


Abstract
11C-acetate has been used extensively for the noninvasive assessment of myocardial oxygen consumption and viability with PET. The use of early uptake of acetate by the heart to measure myocardial perfusion has been proposed. This study evaluated the application of 11C-acetate for absolute measurement of myocardial blood flow using a simple compartmental model that does not require blood sampling. Methods: Eight healthy volunteers and 13 subjects with concentric left ventricular hypertrophy were studied under resting conditions with both 11C-acetate and 15O-water. Myocardial blood flow with 11C-acetate was obtained by fitting the first 3 min of the blood and tissue tracer activity curves to a two-compartment model. Flows obtained were compared with a validated approach using 15O-water. Results: In healthy volunteers, regional myocardial perfusion at rest estimated with 11C-acetate was comparable with values obtained with 15O-water (1.06 ± 0.25 and 0.96 ± 0.12 mL/g/min, respectively). Perfusion in subjects with left ventricular hypertrophy was also comparable if the recovery coefficient (FMM) used was corrected for ventricular mass. If a fixed FMM was used, flow was greatly overestimated. FMM could be estimated from left ventricular mass (FMM = 0.46 + 0.002 × mass, r = 0.86, P < 0.0001). Conclusion: The results of this study suggest that 11C-acetate can be applied to quantitatively estimate myocardial perfusion under resting conditions using a two-compartment model without the need for blood sampling, provided that an appropriate FMM is chosen. This approach should increase the usefulness of this tracer and obviate administration of a separate tracer to independently measure perfusion.
Acetate labeled with 11C can be used for the noninvasive assessment of myocardial oxygen consumption (1–4) and for predicting viability (5,6). However, interpreting changes in myocardial metabolism requires concomitant assessment of regional myocardial perfusion. Although blood flow measurement with PET using 15O-water or 13N-ammonia as tracers represents a suitable approach for obtaining perfusion information (7), use of the tracers brings an attendant increase in time, expense, and radiation burden to the patient.
Because the initial distribution of 11C-acetate is related to blood flow, Gropler et al. (8) proposed that imaging this early distribution could be used as a semiquantitative measurement of perfusion. More recently, compartmental modeling has been used to simultaneously determine myocardial oxygen consumption and blood flow with 11C-acetate and PET (9–11). However, implementation of these approaches requires correction for the conversion of labeled acetate to 11CO2, as well as correction for the conversion of other labeled metabolites in arterial blood. Because acetate is readily taken up by the myocardium with little clearance of the isotope during the first 3–4 min after injection (2,11,12), even simpler models could be used to characterize the initial uptake and distribution of tracer. These less complicated models would not attempt to characterize the complexity of acetate metabolism in myocardial tissue; rather, they represent approximations to the kinetics of the initial tracer distribution, which depends on blood flow.
Accordingly, the objective of this study was to assess the possibility of using a simplified compartmental model to obtain valid measurements of myocardial blood flow with 1-11C-acetate in resting patients. Studies were performed on healthy volunteers and patients with left ventricular hypertrophy to test the hypothesis that accurate measurements of wall thickness (using echocardiographic measurements) can improve the accuracy of myocardial blood flow estimates by providing an independent estimate of the tissue recovery coefficient (FMM) specific to each patient.
MATERIALS AND METHODS
The protocol was approved by the institutional review board of the Columbia-Presbyterian Medical Center, New York, NY. Written informed consent was obtained from each subject before the study.
Subjects
The study population consisted of a control group of eight healthy volunteers (four men, four women; mean age [±SD], 42 ± 8 y) and 13 patients with concentric left ventricular hypertrophy secondary to elevated arterial pressure (nine men, four women; mean age, 54 ± 11 y) (Table 1). None of the healthy volunteers had a history or clinical evidence of heart disease, and all were free of cardiac risk factors and had normal results from electrocardiography and echocardiography. The patients with hypertrophy had hypertension, a left ventricular wall thickness greater than or equal to 11 mm as assessed by echocardiography, and no electrocardiographic evidence of prior myocardial infarction (Table 1).
Summary of Clinical Data of Study Subjects
PET
Imaging was performed on a whole-body tomograph (ECAT EXACT-47; CTI-Siemens, Knoxville, TN) with simultaneous acquisition of 47 transaxial images. The performance characteristics of the tomograph have been reported previously (13). Although the intrinsic in-plane resolution was 6.5 mm (full width at half maximum), images were reconstructed with a Hanning filter (cutoff frequency, 0.4 cycles per pixel), yielding an effective resolution of 10.5 mm.
A short scan obtained with the 68Ge–68Ga rod source was used to assess patient positioning and was followed by a 20-min transmission scan to correct for photon attenuation. Indelible marks were placed on the subject’s torso, and positioning was checked frequently through laser localization.
For assessment of myocardial perfusion with 15O-water, a bolus of 555–740 MBq 15O-water was injected through a large-bore catheter into an antecubital vein and data were collected for a total of 5 min (24 × 5 s, 6 × 10 s, and 8 × 15 s). After a period to allow for tracer decay (average, 10 min), 555–925 MBq 11C-acetate were injected intravenously as a bolus. Data were collected for a total of 29 min (18 × 5 s, 10 × 30 s, 15 × 60 s, and 3 × 2.5 min), but only the first 3 min were used for the acetate flow data. Administration of tracers was designed so as not to exceed a system dead time of greater than 30%.
Analysis of PET Images
Data from the 47 transaxial planes in each scan were decay corrected and reoriented into short-axis slices as previously described (14). The 11C-acetate study frames obtained 4–6 min after injection were summed, and 6–8 midventricular slices were selected for analysis. Regions of interest were defined for eight equally spaced sectors (45° each), with each sector having a width of approximately 1 cm centered around the peak circumferential activity within the myocardium (14). The regions of interest were copied onto all frames of the 11C-acetate and 15O-water studies, and tissue time–activity curves were generated. Time–activity curves for arterial blood were defined from small regions of interest within the left ventricular cavity derived from two to three planes close to the base of the left ventricle. These blood curves were averaged for use as input in the compartmental model. For each collection, data acquisition was started just before the beginning of tracer administration.
Estimation of Myocardial Blood Flow
Myocardial blood flow was determined with 15O-water using a previously validated one-compartment model relating arterial input to myocardial tissue activity (7,15). The parameters estimated from the model include myocardial blood flow, the spillover fraction of tracer activity from blood to myocardial tissue (FBM), and the FMM. Because the coefficient of variation for flow was small (12% ± 5%), blood flow measurements were averaged across all regions of interest to obtain a mean value for myocardial blood flow.
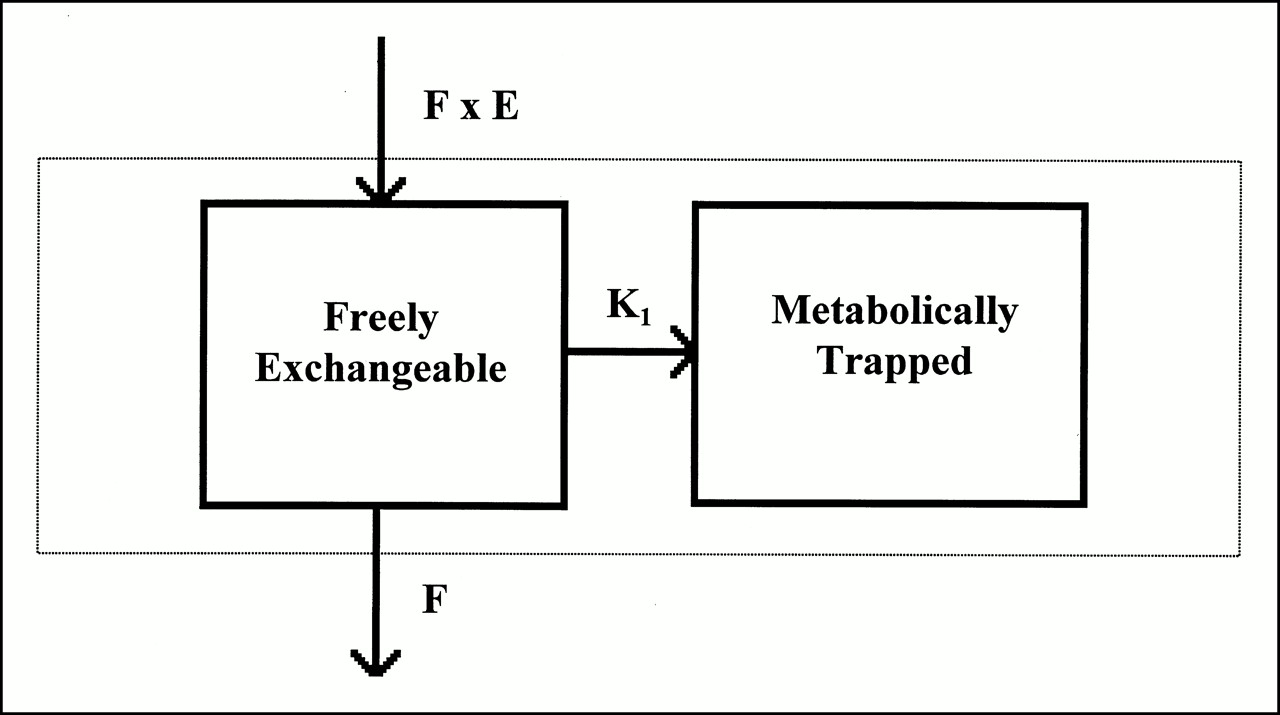
A simplified two-compartment model was used to analyze 11C-acetate data (Fig. 1). In this model, tracer extracted from blood entered the freely exchangeable compartment, where it could be either transported into the metabolically trapped tissue compartment or washed out of the freely exchangeable compartment as a function of blood flow. No provision was made for metabolism of tracer. Importantly, only the first 180 s of the acetate dataset was used.

Compartmental model used to fit first 3 min of 11C-acetate tracer activity data. Model assumes that tracer enters freely exchangeable tissue pool at rate of F × E, where F is myocardial blood flow rate and E is extraction fraction for acetate. Tracer in freely exchangeable tissue pool either leaves that compartment and enters metabolically trapped pool with rate constant K1 or is washed out as function of blood flow.
The differential equations defining tracer kinetics are described by the following:
 1
1
 2
where Q1 and Q2 are tracer activity in the freely exchangeable and metabolically trapped compartments, Ca is tracer activity in arterial blood, F is myocardial blood flow, E is first-pass extraction fraction, and K1 is the rate of transport into the metabolically trapped pool. The observed tissue activity is expressed as:
2
where Q1 and Q2 are tracer activity in the freely exchangeable and metabolically trapped compartments, Ca is tracer activity in arterial blood, F is myocardial blood flow, E is first-pass extraction fraction, and K1 is the rate of transport into the metabolically trapped pool. The observed tissue activity is expressed as:
 3
FBM includes both spillover of counts from blood in the adjacent left ventricular cavity and counts from the fractional blood volume within the tissue region of interest.
3
FBM includes both spillover of counts from blood in the adjacent left ventricular cavity and counts from the fractional blood volume within the tissue region of interest.
To fit the 11C-acetate tissue activity curves, the differential equations were integrated numerically and the model parameters were estimated using an iterative multivariate secant method (16) contained in PROC NLIN from SAS 6.12 (SAS Institute, Cary, NC). The 11C-acetate tissue tracer activity curves for each sector were averaged across planes, and the first 3 min of data were used for analysis.
Data Analysis
Two separate sets of analyses were performed. In the first set, F, K1, and FBM were estimated while E was fixed at a value of 0.75 and FMM was set to 0.65, corresponding to the FMM expected for a uniform wall thickness of 1 cm. The value for extraction fraction was chosen to correspond to values previously obtained for 11C-acetate analyzed with compartmental models (10,11).
The second set of analyses was performed to investigate the degree of improvement in the accuracy of model-derived estimates of myocardial blood flow using patient-specific FMMs. These analyses proceeded as follows. The first step was to refit the 11C-acetate tissue activity data estimating FMM, K1, and FBM with the parameter F set to each individual’s value for myocardial blood obtained with 15O-water. The estimated values for FMM were then related to echocardiographic measurements (left ventricular mass or wall thickness) to develop a regression equation for predicting FMM that could be used with the original model to yield revised estimates of F, K1, and FBM.
To obviate the effect of using the same set of subjects to both develop a regression equation and test its predictions, a jackknife procedure was used (17). The jackknife procedure consisted of calculating a separate regression curve for each subject, in which that subject’s values were not used for calculating a slope and intercept of the regression curve. That subject’s value for the independent variable (left ventricular mass or wall thickness) was then used to provide an estimate of FMM from the slope and intercept of the regression curve that excluded that subject’s data. This technique provided almost unbiased estimates of the dependent variable, FMM, that mimicked the results that would have been obtained from a prospective study in another group of subjects (18).
Three-Dimensional Echocardiography
For evaluation of left ventricular mass, three-dimensional echocardiography was used (19–21). A three-dimensional echocardiographic system (K3 Systems, Inc., Darian, CT) with an acoustic spatial locator (model GP8–3D; Science Accessories Corp., Stamford, CT) connected to a personal computer was linked to a conventional two-dimensional echocardiographic system (model 77020AC; Hewlett-Packard, Andover, MA). The conventional 2.5-MHz sonographic transducer was fitted with three rigidly mounted sound emitters that were energized in sequence. The sound waves emitted a frequency of 60 kHz received by an array of four microphones positioned approximately 0.75 m above the patient. The sound emitters and overhead microphone array and their electronics composed the acoustic spatial locator. The image, along with its Cartesian coordinates, was stored in the personal computer for subsequent off-line reconstruction of the heart chambers.
Left ventricular volume was computed from a series of real-time short-axis images acquired using a novel line-of-intersection display as a guide (19–21). Temporary short-axis images were obtained at the base and apex. These temporary images were used to correctly position the two reference long-axis images through the center of the aortic valve and the apex. Subsequent real-time short-axis images intersected the reference long-axis image, creating a single line to both images, the line of intersection.
Preparation of Tracers
15O-water and 11C-acetate were prepared as described in detail elsewhere (1,22). The radiochemical purity of 11C-acetate was typically greater than 99.5%.
Statistical Analysis
Values are reported as mean ± one SD. The significance of differences between 15O-water and 11C-acetate estimates of myocardial blood flow was assessed by a paired t test. Differences in the accuracy of the techniques for measuring blood flow with 11C-acetate were assessed by the Wilcoxon paired-sample test (23). Bland-Altman analysis was performed to assess methodologic bias and to calculate the limits of agreement (24).
RESULTS
Echocardiographic Measurements
Echocardiographic measurements for the two groups of subjects are listed in Table 1. For healthy volunteers, wall thickness averaged 8.7 ± 1.9 mm and left ventricular mass averaged 123 ± 15 g. The corresponding values for the hypertrophy patients were markedly elevated, with a mean wall thickness of 12.9 ± 1.4 mm and a left ventricular mass of 186 ± 42 g (P < 0.001 for each comparison).
Myocardial Blood Flow Measurements with 15O-Water
For the entire study population, myocardial blood flow measured at rest with 15O-water averaged 1.02 ± 0.19 mL/g/min (Table 2). Blood flow at rest ranged from 0.69 to 1.39 mL/g/min. No significant difference was observed between average blood flow in the healthy volunteers, 0.96 ± 0.12 mL/g/min, and average blood flow in the hypertrophy patients, 1.06 ± 0.22 mL/g/min (Table 2).
Summary of Myocardial Blood Flow
Estimates of Myocardial Blood Flow with 11C-Acetate
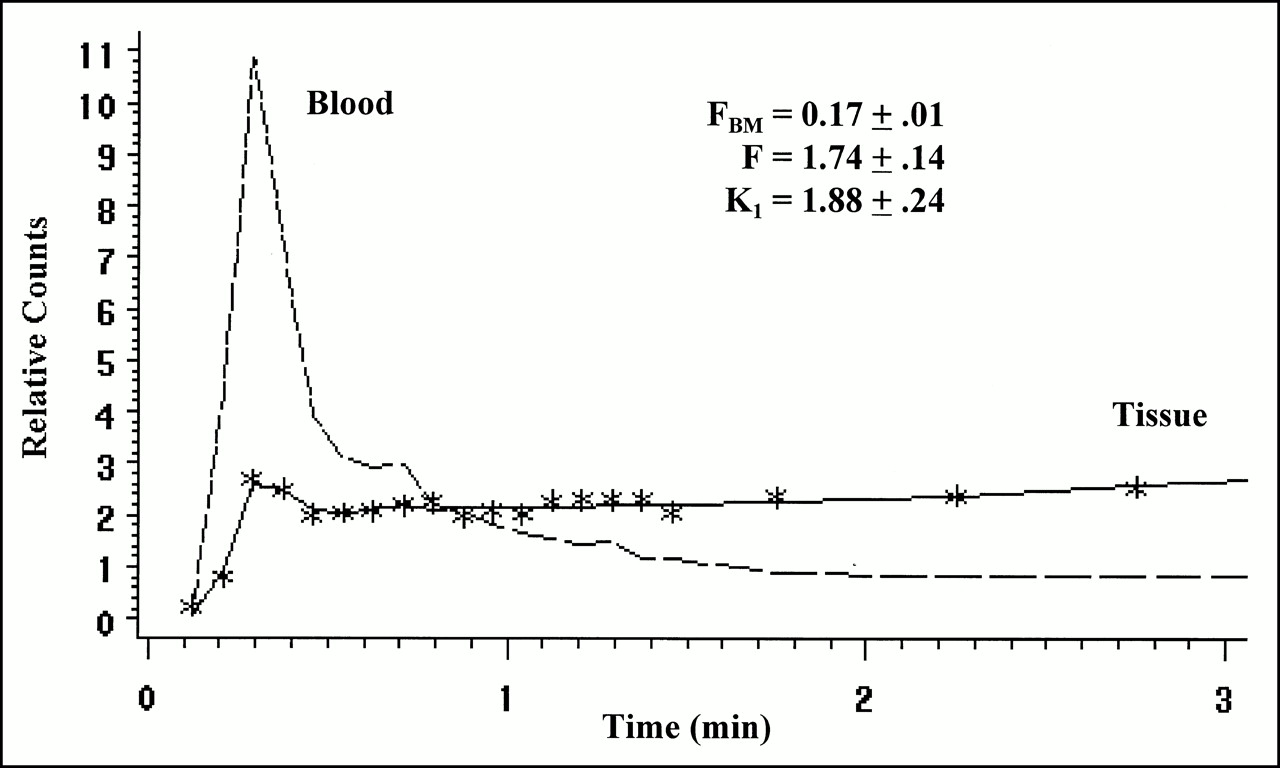
Figure 2 depicts a representative example of the model fit to 11C-acetate data. For the entire study population, myocardial blood flow with the model using a single fixed value of 0.65 for FMM averaged 1.35 ± 0.33 mL/g/min, which was significantly greater than the value measured with 15O-water (P < 0.001; Table 2). Average blood flow in the healthy volunteers (1.06 ± 0.25 mL/g/min) was not significantly different from the value obtained with 15O-water, whereas 11C-acetate measurements of myocardial blood flow in the hypertrophy patients (1.53 ± 0.22 mL/g/min) significantly overestimated myocardial blood flow measured with 15O-water (P < 0.001) (Table 2).

Blood (dashed line) and myocardial 11C-acetate tissue tracer activity data (symbols) along with model fits (solid line) from one subject. Parameter estimates are displayed along with their associated SEs derived from variance–covariance matrix of model parameters.
Although many models for estimating myocardial perfusion with tracers such as 13N-ammonia use a fixed FMM, patients with hypertrophy by definition do not have normal myocardial thickness; thus, use of a fixed, normal FMM is inappropriate. Accordingly, we applied the relationship between echocardiographically defined myocardial mass and FMM to correct the estimates of myocardial perfusion using 11C-acetate.
Values for FMM in individual subjects were obtained by refitting the 11C-acetate tracer activity curves after fixing the myocardial blood flow to the value obtained with 15O-water. For the healthy volunteers, FMM averaged 0.69 ± 0.09. For hypertrophy patients, FMM averaged 0.84 ± 0.08, reflecting the increased left ventricular mass and wall thickness in this group.
The estimated values for FMM were related to left ventricular mass by linear regression. Figure 3 shows the correlation obtained for the entire study population with the regression equation FMM = 0.46 + 0.002 × mass (r = 0.86, P < 0.0001). A similar analysis using left ventricular wall thickness (measured in millimeters) as the independent variable yielded the relationship FMM = 0.41 + 0.033 × wall thickness (r = 0.77, P < 0.0001). Finally, an additional analysis was performed using body surface area as the independent variable to evaluate whether a nonechocardiographic variable could be useful for predicting FMM. A relatively weak but statistically significant relationship was found with the regression equation FMM = 0.23 + 0.288 × body surface area (r = 0.58, P < 0.01).
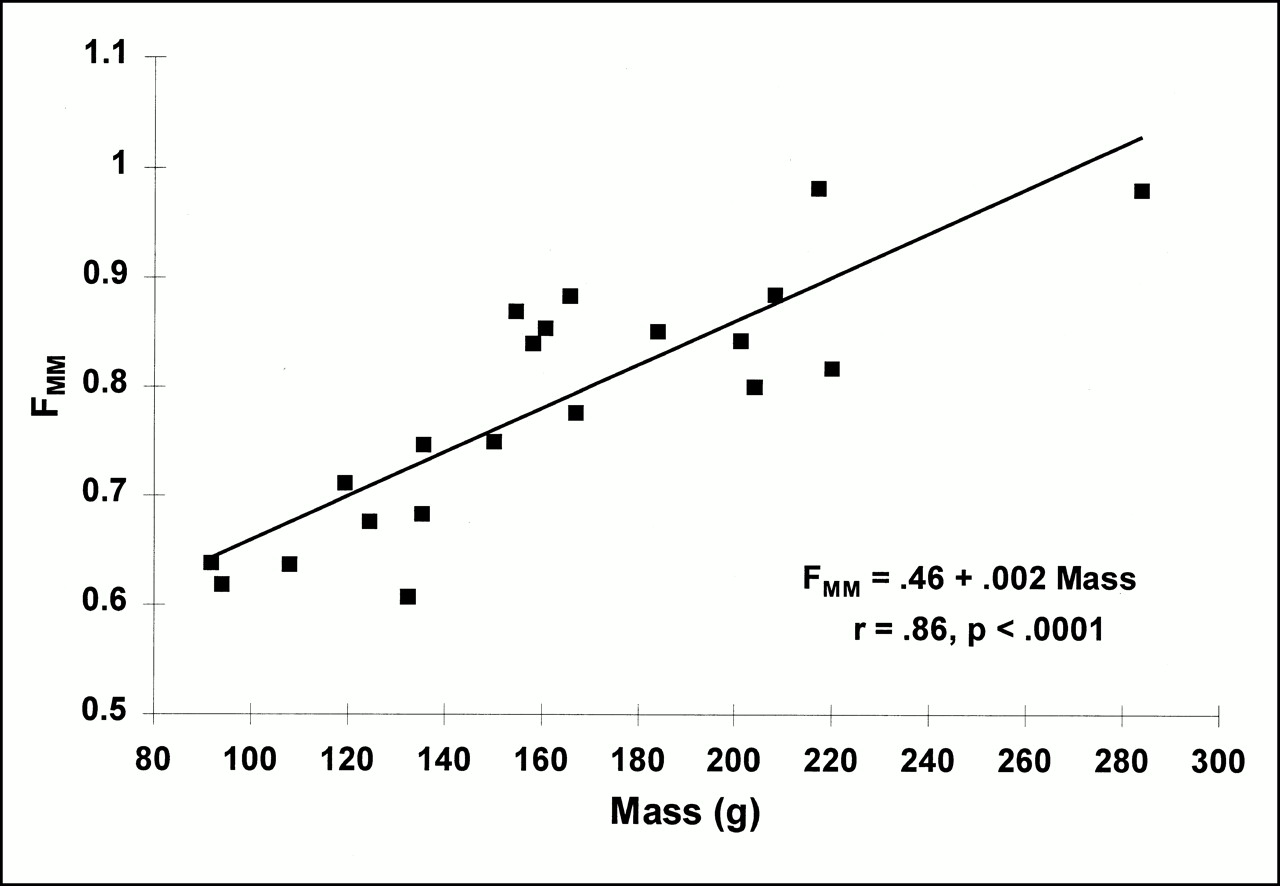
Relationship between tissue FMM and echocardiographic measurements of left ventricular mass. Echocardiographic mass measurements were used to provide regression-based estimates of FMM for each subject to be used in analyzing 11C-acetate tissue tracer activity data.
Tracer kinetic data were reanalyzed using jackknifed values derived from myocardial mass, wall thickness measurements, and body surface area. The results from using subject-specific values for FMM derived from left ventricular mass measurements are displayed in Table 2. The jackknifed values for myocardial blood flow were not significantly different from 15O-water measurements of blood flow: 0.93 ± 0.17 for the healthy volunteers and 1.12 ± 0.18 for the hypertrophy patients (Fig. 4). The regression equation relating myocardial blood flow measured with 15O-water and 11C-acetate is shown in Figure 5. The mean square error for the entire study population was 0.12 mL/g/min. Figure 6 depicts the results of the Bland-Altman analysis showing the bias and limits of agreement of the jackknifed estimates of blood flow.
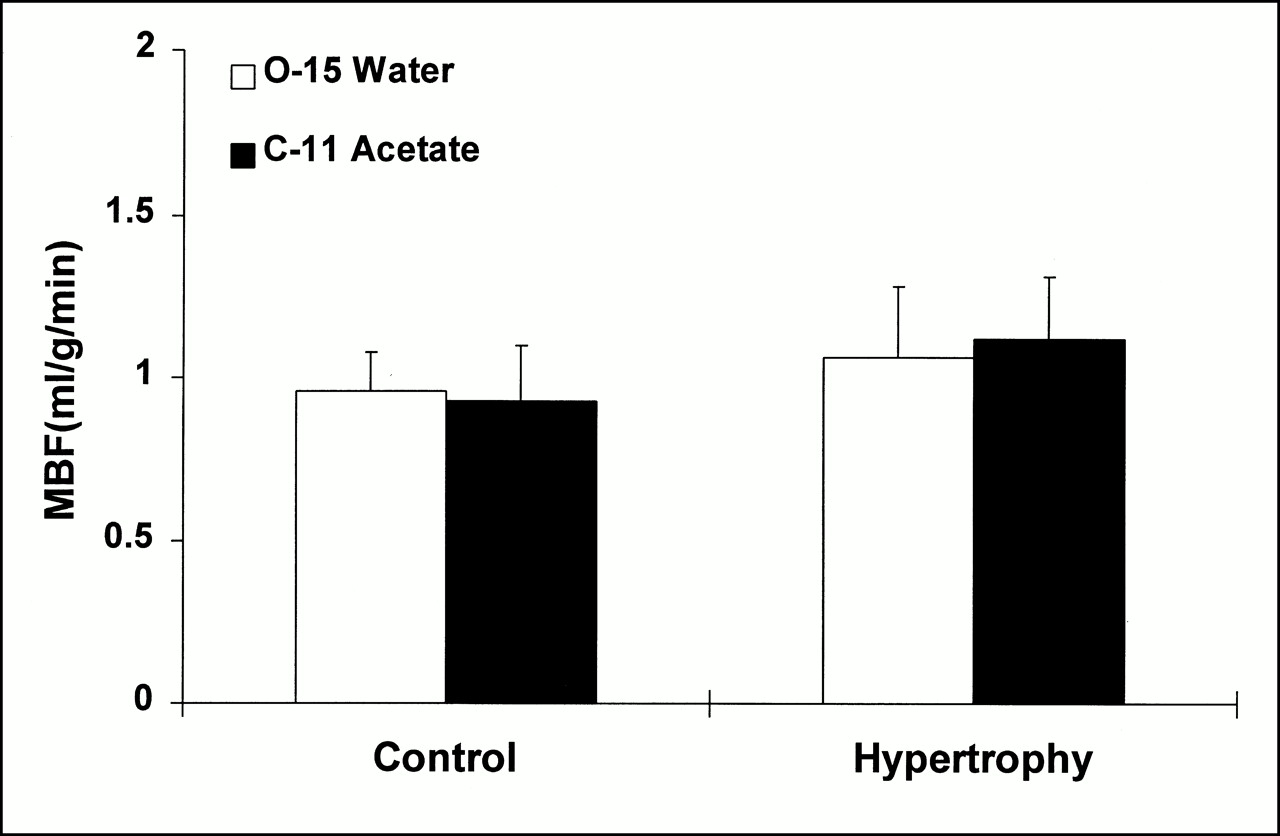
Histogram of average blood flow data obtained from measurements made with 15O-water and 11C-acetate using individual values of FMM. Both in healthy volunteers and in patients with left ventricular hypertrophy, use of subject-specific FMM yielded myocardial blood flow (MBF) estimates comparable with those obtained with 15O-water.

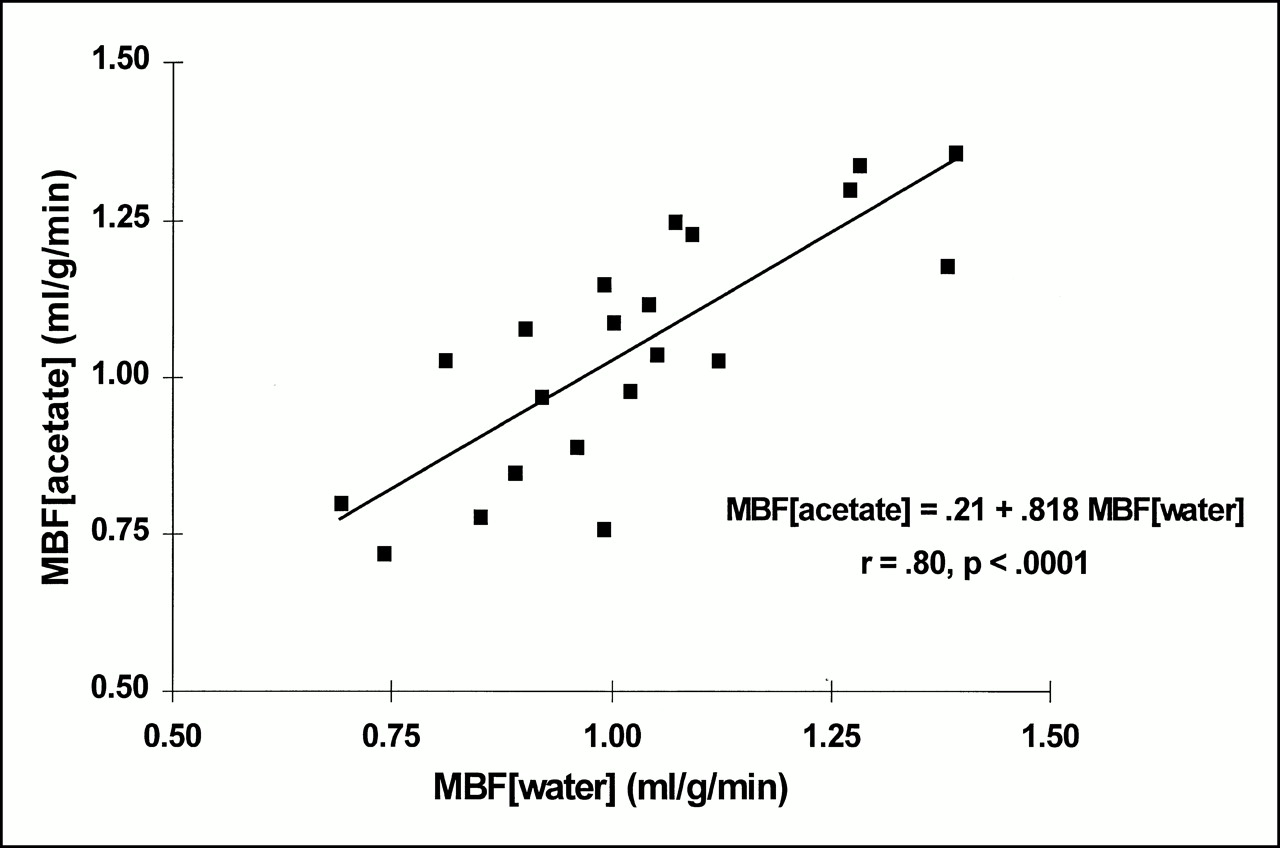
Relationship between myocardial blood flow (MBF) measured with 11C-acetate and with 15O-water. 11C-acetate blood flow estimates were obtained using individualized values of FMM that were derived from echocardiographic mass measurements for each subject.

Bland–Altman analysis showing degree of concordance between myocardial blood flow (MBF) measured with 11C-acetate and with 15O-water. Magnitude of bias was small (0.02 mL/g/min), with limits of agreement ranging from value of −0.22 mL/g/min to 0.27 mL/g/min. No trends in residuals were observed as function of increasing blood flow rate.
Myocardial blood flow estimates derived from left ventricular mass were more accurate than those obtained using wall thickness measurements or body surface area (Table 2; P < 0.01 for both comparisons). Using wall thickness measurements yielded blood flow values that were not significantly different from those obtained with 15O-water: 0.97 ± 0.20 for the healthy volunteers and 1.10 ± 0.16 for the hypertrophy patients. The mean square error for the entire study population was 0.15 mL/g/min. These jackknifed estimates were significantly more accurate than the original blood flow estimates in the hypertrophy patients (P < 0.005).
Jackknifed estimates of myocardial blood flow derived from body surface area measurements also yielded blood flow values that were not significantly different from those obtained with 15O-water: 0.90 ± 0.25 for the healthy volunteers and 1.14 ± 0.22 for the hypertrophy patients. The mean square error for the entire study population was 0.18 mL/g/min. These jackknifed estimates were also significantly more accurate than the original blood flow estimates in the hypertrophy patients (P < 0.001).
DISCUSSION
Estimates of myocardial metabolism with tracers such as 11C-acetate have become useful in evaluating the metabolism of the heart. However, for all estimates of metabolism, myocardial perfusion must also be defined, typically through a separate acquisition using a flow tracer. The aim of this study was to determine whether, because the initial distribution of acetate is proportional to flow, a simple compartmental model could be used to estimate myocardial perfusion.
The first attempt at using 11C-acetate for determining perfusion was by Gropler et al. (8), who used a simple integral image of the first 3 min after administration of 11C-acetate for obtaining an index of perfusion. However, this approach suffers from difficulties related to the decoupling of extraction from flow, partial-volume effects, and the lack of quantitative information. Subsequently, compartmental models were proposed for estimating perfusion with 11C-acetate (9–11). However, these require sampling and analysis of blood and also use a fixed value for FMM.
One of the assumptions of our approach is that no significant amount of acetate extracted by the myocardium egresses as labeled CO2 or other labeled metabolites during the first 3 min of imaging. On the basis of studies on isolated perfused hearts as well as on intact dogs and humans, this assumption is reasonable under resting conditions (1–4,11,12) but may not be applicable when the myocardium has a higher metabolic level (i.e., under stress conditions).
In this study, myocardial perfusion estimated with acetate, when corrected for FMM, correlated with estimates obtained from 15O-water over a flow range of 0.69–1.39 mL/g/min. The slope was 0.8, with an intercept of 0.2, suggesting some degree of systemic error over this relatively narrow flow range. Several factors may be involved, including fixing the extraction fraction for acetate at 0.75. Although this approximation is based on experimental and preliminary human data, it is likely to vary, depending on flow. For this reason, extrapolation of this approach to cases of hyperemic flow should be viewed with caution. Other factors that may decouple flow from extraction may also adversely affect the relationship.
We showed that using a fixed value of FMM is likely to result in errors, especially when interrogating hearts that are not normal, as would be the case for patients either with hypertrophy or with infarction or wall thinning. We also showed that echocardiographic measurements can be used to define FMM, which subsequently can be used in the compartmental model. This approach has been suggested (25,26) but has not been used widely because of the need for a separate echocardiographic measurement. However, as mathematic models to describe the kinetics of tracers become more complex, some parameters need to be fixed. For many tracers of myocardial perfusion, such as 13N-ammonia, fixed values of FMM have been used. Although errors can result, particularly with models in which blood estimates depend on tracer uptake, this issue has received limited attention. The data presented here show the sensitivity of one such model to fixed values of FMM and show that when appropriate corrections are used, the compartmental model accurately estimates myocardial perfusion using 11C-acetate. Although echocardiography is a means to assess wall thickness, and many subjects undergoing PET have separate echocardiographic measurements, weaker approximations of FMM can still be made with body surface area analysis. Use of a fixed FMM may yield substantial error, especially in subjects with hypertrophy. Approaches that model wall thickness from the line spread function of radioactivity in the myocardial wall (14) may similarly provide an estimate of FMM and will further simplify the approach.
Future investigations will need to assess the accuracy of this approach in patients with wall thinning or infarction. Nonetheless, the data show that estimates of myocardial perfusion in mL/g/min are attainable with this tracer and may obviate separate estimates of myocardial perfusion.
CONCLUSION
The use of PET studies with 11C-acetate has been increasing both for delineation of myocardial viability (5,6) and for assessment of regional myocardial oxygen consumption. In the approach we describe, myocardial perfusion can be estimated directly with the same tracer used to determine myocardial oxygen consumption. This approach should be useful in shortening clinical protocols, decreasing time in the scanner, and decreasing the radiation burden to patients.
Acknowledgments
The authors thank Melanie Phipps, Irene Diaz, and Kristine Kulage for preparing the typescript. The authors also thank the members of the PETNet Pharmacy for preparing 15O-water, the technologists of the Kreitchman PET Center for providing technical assistance with the scans, Dr. Dah-Ren Hwang and Norman Simpson for preparing 11C-acetate, Lyna El-Koury Coffin for performing the echocardiography, and Dr. Donald King for interpreting the echocardiographic findings. This study was supported in part by an educational grant from the Society of Nuclear Medicine, Reston, VA, and by grants R01 HL46895, R01 HL58408, and RR 00645 from the National Institutes of Health, Bethesda, MD.
Footnotes
Received Apr. 6, 2000; revision accepted Jul. 14, 2000.
For correspondence or reprints contact: Steven R. Bergmann, MD, PhD, College of Physicians and Surgeons, Columbia University, 630 W. 168th St., PH 10 Stem-405, New York, NY 10032.


