


Abstract
In this study, the oral radioactivity seen in salivary gland scintigraphy, which was established entirely on the basis of radioactive saliva secreted by the parotid and submandibular glands, was evaluated quantitatively in healthy volunteers and in patients with Sjögren’s syndrome. Methods: Salivary gland scintigraphy and labial biopsy were performed on 70 patients with Sjögren’s syndrome. After intravenous administration of 99mTc-sodium pertechnetate, dynamic scintigraphy was performed and time–activity curves for the oral cavity and four major salivary glands were generated. Lemon juice stimulation was delivered at 40 min. The prestimulatory oral activity index, poststimulatory oral activity index, and time interval between the vascular perfusion peak and the prestimulated maximum oral activity point were calculated to quantify the oral activity. Other glandular functional parameters—namely, maximum accumulation (MA), maximum secretion, secretion velocity, time at maximum count, time interval from stimulation to minimum count, and uptake ratio (UR) of the parotid and submandibular glands—were also calculated. Salivary gland scintigraphy was also performed on 21 healthy subjects with no evidence of salivary gland malfunction. Results: Histopathologic grade 1 or 2 was found in 29 patients and grade 3 or 4 was found in 41 patients, and they were regarded as being in the early and advanced stages of Sjögren’s syndrome, respectively. After overall analysis, all of the oral activity indices and the MA and UR of the submandibular gland clearly decreased as clinical severity progressed, and statistically significant differences were observed. Conclusion: New oral activity indices correlated with the stage of Sjögren’s syndrome, and these quantitative oral indices together with certain glandular parameters (mainly MA and UR of the submandibular gland) were found to be sensitive enough to distinguish the disease severity of Sjögren’s syndrome.
Sjögren’s syndrome is a well-known chronic autoimmune disease characterized by lymphocytic infiltration and destruction of salivary and lacrimal gland tissue, resulting particularly in a reduction of salivary function. Reliable detection of impaired salivary function is crucial to the diagnosis of xerostomia in patients with early Sjögren’s syndrome. The most specific diagnostic method for Sjögren’s syndrome is labial salivary gland biopsy, but it is invasive, it causes some degree of patient discomfort and risk, and it must be performed and interpreted using strict criteria (1–6). Salivary gland scintigraphy using qualitative or quantitative methods has been suggested as a sensitive, safe, and objective alternative approach to functional and morphological evaluation of salivary involvement in Sjögren’s syndrome (7–13). However, conflicting views regarding the diagnostic merits of salivary gland scintigraphy in Sjögren’s syndrome persist. Uncertainty about which of several scintigraphic parameters are most useful for detection of mildly impaired parenchymatous function of major salivary glands and determination of the clinical stage of Sjögren’s syndrome have been problematic.
van den Akker et al. (14) and van den Akker and Sokole (15) have described the oral radioactivity seen during salivary gland scintigraphy as being entirely attributable to radioactive saliva secreted by the parotid and submandibular glands. Furthermore, some investigators have postulated that coordinated analysis of oral activity and salivary gland activity is more helpful in improving diagnostic performance (14–18). However, to our knowledge, no quantitative evaluations of oral radioactivity in xerostomic patients have been performed.
In this study, we assessed the quantitative indices of oral radioactivity in healthy volunteers and in patients with Sjögren’s syndrome. We correlated oral indices and histopathologic grades of labial gland biopsy specimens or the stage of Sjögren’s syndrome, rather than other parameters, and chose the most simple, reliable, and sensitive variables for determination of the clinical stage of Sjögren’s syndrome.
MATERIALS AND METHODS
Patients
Seventy consecutive patients (68 women, 2 men; age range, 17–74 y; mean age, 51.4 y) in our institution who had xerostomia were studied. They were clinically diagnosed as having Sjögren’s syndrome on the basis of their history and the results of physical and laboratory testing, including labial biopsy. All patients underwent salivary gland scintigraphy at our institution. The patients were divided into two groups according to labial biopsy findings: 29 patients (28 women, 1 man; age range, 17–71 y; mean age, 45.3 y) with histopathologic grade 1 or 2 lesions were regarded as being in the early stage of Sjögren’s syndrome and 41 patients (40 women, 1 man; age range, 18–74 y; mean age, 55.8 y) with histopathologic grade 3 or 4 lesions were regarded as having the advanced stage of Sjögren’s syndrome.
Control Group
Salivary gland scintigraphy was also performed on a group of 21 healthy subjects (8 women, 13 men; age range, 22–82 y; mean age, 57 y), with no evidence of salivary gland malfunction, to obtain control data. All gave informed consent as approved by our institutional review board.
Imaging Examinations
After intravenous administration of 370 MBq 99mTc-sodium pertechnetate, dynamic salivary gland scintigraphy was performed with a gamma camera and data analysis system (PRISM 2000; Shimadzu, Kyoto, Japan) using a low-energy, high-sensitivity, parallel-hole collimator; the images were digitally recorded in a 128 × 128 matrix with a ×2.67 zoom. The energy window around the 140-keV photopeak of 99mTc was 15%. We fixed the head in a slightly extended position during imaging, using a hemicylindric plastic head holder with a radiolucent plastic neck-contoured headrest. The duration of the scan was 50 min, and anterior salivary gland images were acquired sequentially, one frame every 20 s. Salivary gland secretion was stimulated with 2 mL oral lemon juice (100% concentrated juice) instilled with a syringe at 40 min. We also instructed the patients to minimize swallowing during imaging.
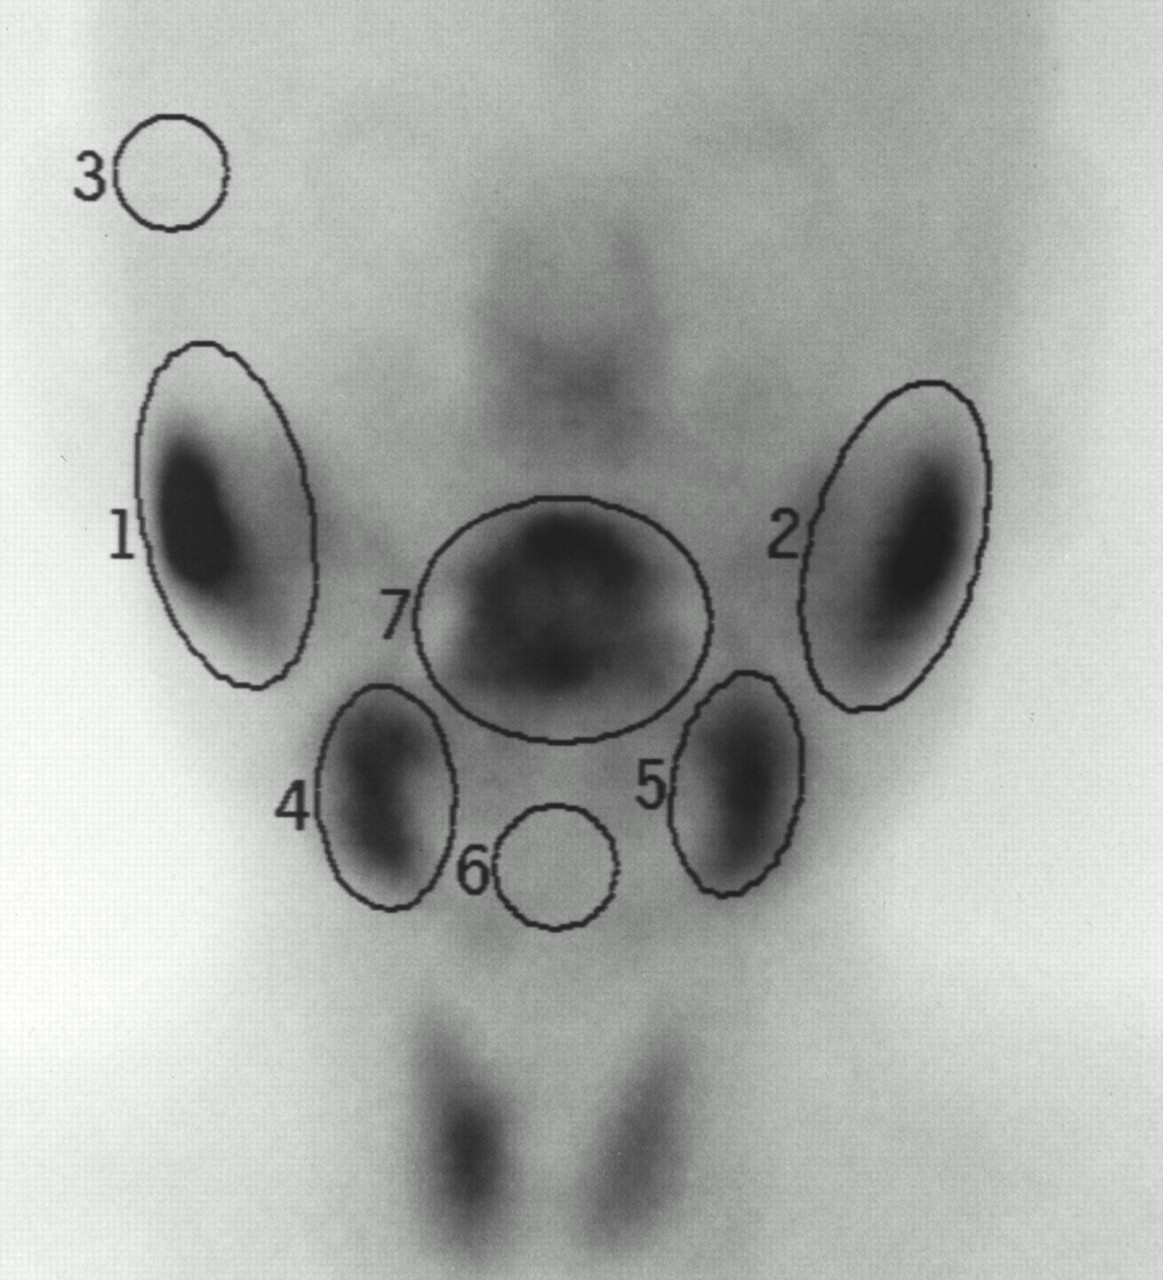
Oval-shaped regions of interest (ROIs) were drawn over the oral cavity and each of the four major salivary glands on a total of 150 frames of summation images of dynamic salivary gland scintigraphy. Background ROIs were marked in the temporal and submental regions near the parotid and submandibular glands, respectively (Fig. 1). Time–activity curves were generated by background subtraction and three-point smoothing. The following points were designated on the schematic presentation of the time–activity curve for the oral activity (Fig. 2A): point X, the initial shoulder, representing a vascular perfusion peak; point Y, the maximum activity point before stimulation; point Z, the maximum activity point after stimulation; the following points were designated on the schematic presentation of the glandular time–activity curve (Fig. 2B): point A, the initial shoulder, representing a vascular perfusion peak or, if the shoulder is unclear, at 1 min; point B, the maximum activity point before stimulation; point C, the stimulation point at 40 min; point D, the point at 41 min; point E, the minimum activity point after stimulation. B and C will be the same point in the gland with continuous uptake, showing a monotonic increase in activity until the lemon juice stimulation. In addition, the counts at points X, Y, and Z and at points A, B, C, D, and E are shown as x, y, z, a, b, c, d, and e, respectively.

ROIs on scintigraphic image: area 7, oral cavity; areas 1 and 2, parotid glands; areas 4 and 5, submandibular glands; area 3, background for parotid glands; area 6, background for submandibular glands and oral cavity. Area numbers are adjacent to each ROI.
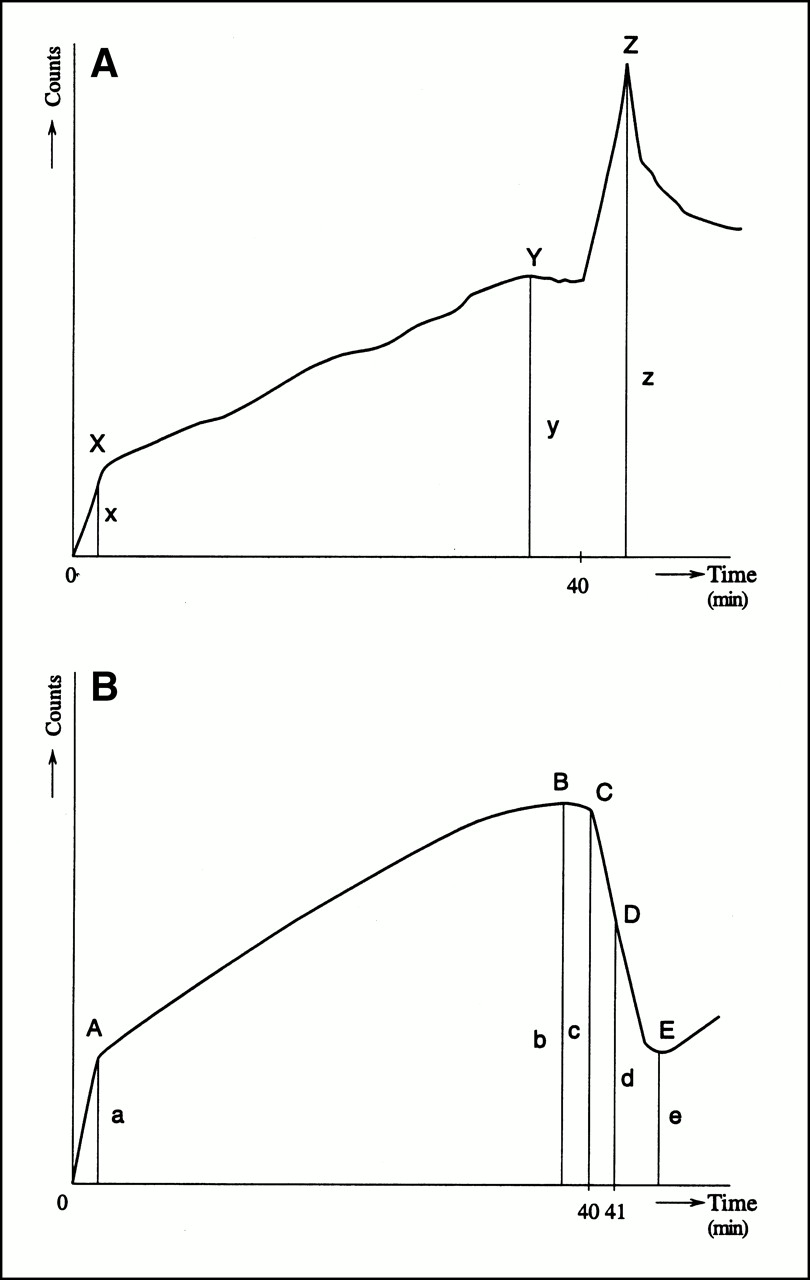
Schematic presentation of time–activity curve for oral activity (A) and glandular activity (B) in normal pattern on salivary gland scintigraphy. (A) X = initial shoulder, representing vascular perfusion peak; Y = maximum activity point before stimulation; Z = maximum activity point after stimulation; x, y, and z = counts at X, Y, and Z, respectively. (B) A = initial shoulder, representing vascular perfusion peak or, if shoulder is unclear, at 1 min; B =maximum activity point before stimulation; C = stimulation point at 40 min; D = point at 41 min; E = minimum activity point after stimulation; a, b, c, d, and e = counts at A, B, C, D, and E, respectively.
To quantify oral activity, the prestimulatory oral activity index (PRI), poststimulatory oral activity index (POI), and time interval between the vascular perfusion peak and the prestimulated maximum oral activity point (TI) were calculated from numerical data obtained from the time–activity curves (Table 1).
Definition of Oral Activity Indices in Salivary Gland Scintigraphy
The following functional parameters (Table 2) were calculated for each salivary gland: maximum accumulation (MA), maximum secretion (MS), secretion velocity (SV), time at maximum count (point B) (Tmax), time interval from stimulation to minimum count (time interval between points C and E) (Tmin), and uptake ratio (UR). Mean values of the bilateral glands were used for data analysis.
Definition of Glandular Parameters in Salivary Gland Scintigraphy
Labial Biopsy
Labial salivary gland biopsy was performed by the standard method (1). The minor salivary glands of the lower lip were routinely fixed, sectioned, and stained with hematoxylin and eosin and examined for the presence of lymphocytic foci or diffuse lymphocytic infiltration (or both) by an experienced pathologist. The degree of histopathologic change was graded from 0 to 4 according to Chisholm and Mason’s grading standard (1) (Table 3).
Grading Criteria for Labial Salivary Gland Biopsy Specimens
Statistical Analysis
All oral activity indices and glandular parameters are expressed as mean ± SD. An unpaired t test and the Mann-Whitney U test were used to statistically analyze all mean values and to compare differences among the three groups: healthy control subjects, patients with early-stage Sjögren’s syndrome, and patients with advanced-stage Sjögren’s syndrome. P < 0.05 is considered statistically significant.
RESULTS
Oral Activity Indices
Comparisons of oral activity indices among the three groups are summarized in Table 4. All oral activity indices (PRI, POI, and TI) decreased significantly with advancing stages of Sjögren’s syndrome.
Overall Analysis of Comparisons Among Quantitative Activity Indices of Oral Cavity in Healthy Subjects, Patients with Early-Stage Sjögren’s Syndrome, and Patients with Advanced-Stage Sjögren’s Syndrome
Glandular Functional Parameters
Comparisons of salivary gland functional parameters among the three groups are summarized in Table 5. The Tmax of the parotid gland and the MS of the submandibular gland did not differ significantly among the three groups. Among the other parameters, the MA and UR of the submandibular gland decreased significantly as the disease stage progressed, the same as the oral activity indices. The decreases in MA, MS, and UR of the parotid gland, the decrease in Tmax of the submandibular gland, and the decrease in SV and increase in Tmin of both the parotid and the submandibular gland were statistically significant when healthy subjects were compared with the advanced-stage group. The decreased SV of the parotid gland also revealed a significant difference between the healthy subjects and the early-stage group. Furthermore, the increase in Tmin and decrease in Tmax of the submandibular gland and the decreases in MS and UR of the parotid gland indicated significant differences between the early- and advanced-stage groups.
Overall Analysis of Comparisons Among All Quantitative Glandular Parameters in Healthy Subjects, Patients with Early-Stage Sjögren’s Syndrome, and Patients with Advanced-Stage Sjögren’s Syndrome
No statistically significant sex and age differences were found in the evaluation of oral or glandular parameters of salivary gland scintigraphy in the healthy subjects.
Pattern of Time–Activity Curves
In addition, visual evaluation of time–activity curves revealed a roughly reciprocal relation between glandular and oral activities and a greater association of the submandibular gland than the parotid gland with spontaneous salivary secretion (Fig. 3). Before stimulation, reciprocal submandibular uptake and oral activities were observed in 16 of 21 healthy subjects (76%), whereas parotid uptake showed the same behavior in 8 of the 21 subjects (38%).

Actual time–activity curves of parotid glands (curves A and B), submandibular glands (curves C and D), and oral cavity (curve E) in 60-y-old healthy man. Parotid gland curves show monotonic uptake until stimulation; submandibular curves show spontaneous secretion, and oral cavity curve reflects resultant activity in mouth. Arrow marks lemon juice stimulation point.
DISCUSSION
Xerostomia results from a reduction in salivary secretion into the oral cavity and may occur as a consequence of systemic salivary gland disorders such as Sjögren’s syndrome and other pathologies, including chronic sialadenitis, use of certain drugs, and irradiation of the head and neck. Causes other than Sjögren’s syndrome can easily be identified by a typical clinical history and were excluded from this study.
Clinically, it may be difficult to distinguish the early stage of Sjögren’s syndrome from normal findings. However, it is important to make an accurate diagnosis because Sjögren’s syndrome can be treated by various trial therapies, including corticosteroids and other immunosuppressants. Salivary gland scintigraphy has been attempted as a substitute for labial salivary gland biopsy, the most specific and definitive diagnostic method for detection of impaired salivary function in Sjögren’s syndrome (7–13). However, there has been uncertainty as to which of several scintigraphic parameters are most useful diagnostically. Some investigators have described the origin and location of radioactive saliva (14,15), and some have proposed coordinated evaluation of oral activity and salivary glandular activity (14–18) but, to our knowledge, no quantitative studies of oral radioactivity have been reported to date.
Our approach to the quantitative evaluation of oral radioactivity takes into account the following points. Periodic spontaneous unstimulated salivary secretion occurred, a roughly reciprocal relation between glandular and oral activity has been seen on time–activity curves, and unstimulated spontaneous secretion comes mainly from the submandibular glands and less frequently from the parotid glands. Hermann et al. (17) also recently reported this different salivary behavior of the parotid and submandibular glands. Thus, reduction of oral activity represents the final result of functional involvement of each of the glands and takes the higher weight assigned to the determination of disease stage.
In this study, we investigated the quantitative indices of oral radioactivity in healthy volunteers and in patients with Sjögren’s syndrome. To cover the wide individual variation in frequency, magnitude, and evolution of spontaneous and stimulated oral salivary secretion, the PRI was used to quantify the amount of spontaneous salivary secretion, the POI was used to quantify the amount of salivary secretion after stimulation, and the TI was used as a time index for the oral evolutionary salivary pool. Under normal physiologic conditions, except for swallowing, multiple episodes of spontaneous salivary secretion lead to the prolongation of the TI, oral saliva output gradually increases with time, and salivary glands respond briskly to gustatory stimulation, resulting in more secretion into the oral cavity. Actually, PRI and TI are specific parameters for the assessment of spontaneous salivary secretion.
The results of this study indicate that, despite a slight discrepancy, decreases in oral activity indices correlate significantly with the histopathologic grade of labial gland biopsy and the stage of Sjögren’s syndrome. In addition, comparisons of other glandular parameters and overall analysis revealed that the three groups (i.e., healthy subjects, early-stage Sjögren’s syndrome, and advanced-stage Sjögren’s syndrome) were distinguished by decreased oral activity indices and MA and UR of the submandibular gland. MA and UR are parameters indicating the quantity of glandular accumulation. We previously reported that decreased accumulation in the submandibular gland is a highly sensitive indicator of salivary gland disease in Sjögren’s syndrome (12,13). Herein, we extend our previous observation to include oral activity indices as simple, reliable, and sensitive indicators for determining the clinical stage of Sjögren’s syndrome. Finally, although each institute or laboratory may need to establish its own normal database, the clearly described and illustrated parameters would be easy to incorporate into general practice.
CONCLUSION
Quantitative oral activity indices together with certain glandular parameters (mainly MA and UR of the submandibular gland) were sensitive enough to distinguish the disease severity of Sjögren’s syndrome. These quantitative variables may be used to identify the stage of Sjögren’s syndrome, and thereby replace the labial gland biopsy, or they can be used to determine the clinical stage in equivocal cases.
Acknowledgments
The authors thank Isao Umehara (Radiology Department, Asahi General Hospital) for his useful contributions, the technologists (Radiology Department, Tokyo Medical and Dental University Hospital) for their assistance, and the healthy volunteers for their cooperation.
Footnotes
Received May 1, 2000; revision accepted Jul. 31, 2000.
For correspondence or reprints contact: Winn Aung, MBBS, Department of Radiology, Faculty of Medicine, Tokyo Medical and Dental University, 1-5-45. Yushima, Bunkyo-ku, Tokyo 113-8519, Japan.
REFERENCES
In this issue


Jump to section
Related Articles
Cited By...
- Evaluating Instantaneous Perfusion Responses of Parotid Glands to Gustatory Stimulation Using High-Temporal-Resolution Echo-Planar Diffusion-Weighted Imaging
- Microvascular autologous transplantation of partial submandibular gland for severe keratoconjunctivitis sicca
- Salivary Gland Scintigraphy: The Use of Semiquantitative Analysis for Uptake and Clearance