

FIGURE 3.

FIGURE 3.
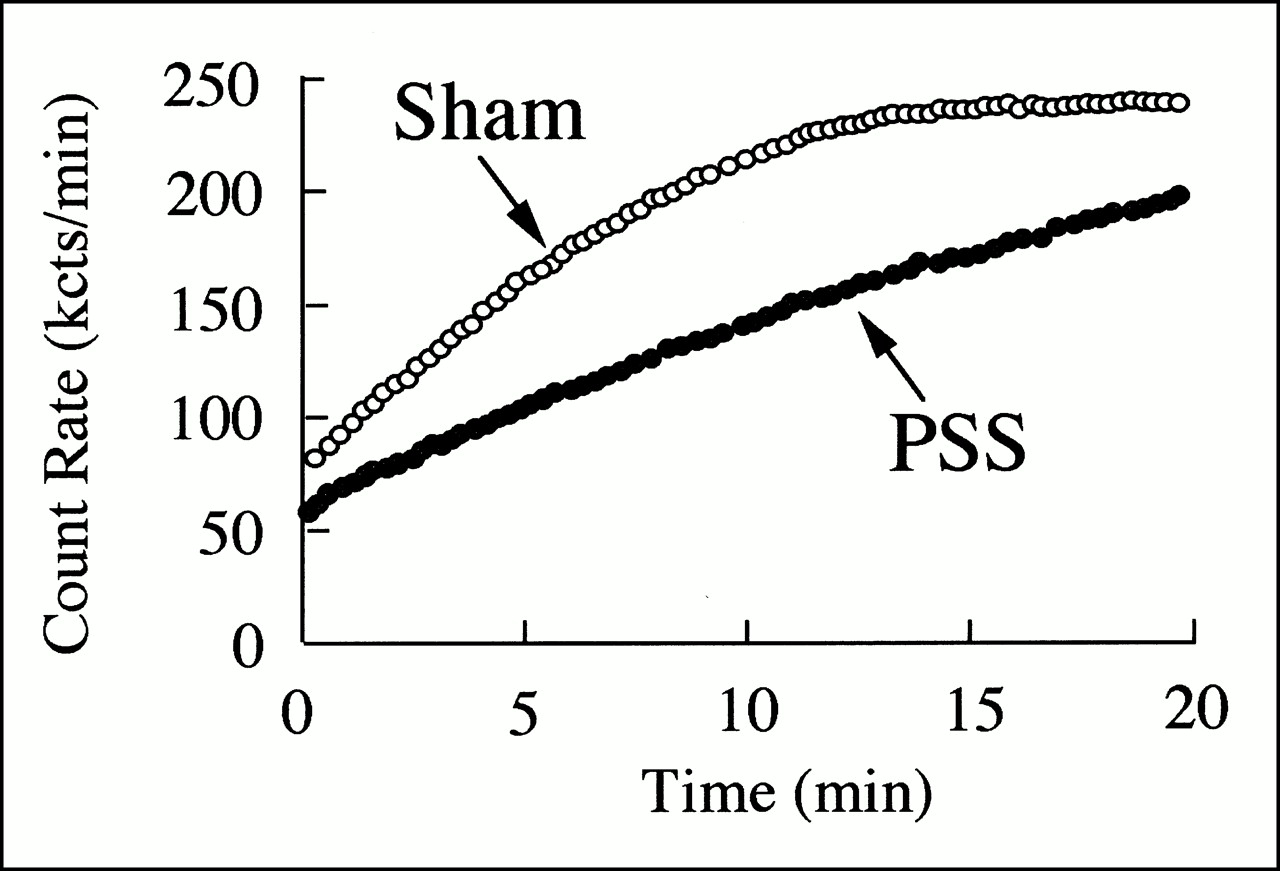
Liver time–activity data with model simulations from two representative studies: sham-operated rat and shunted rat. R̃o of sham-operated rat was 0.286 ± 0.007 nmol/g; receptor concentration [R]o was 0.901 ± 0.021 μmol/L. Shunted rat had R̃o of 0.018 ± 0.001 nmol/g and [R]o of 0.273 ± 0.001 mol/L. kcts = kilocounts.
In this issue


Related Articles
Cited By...
- No citing articles found.