


Abstract
Noninvasive methods for measuring the pharmacokinetics of chemotherapeutic drugs such as 5-fluorouracil (FU) are needed for individualized optimization of treatment regimens. PET imaging of [18F]FU (PET/[18F]FU) is potentially useful in this context, but PET/[18F]FU is severely hampered by low tumor uptake of radiolabel and rapid catabolism of FU in vivo. Pretreatment with eniluracil (5-ethynyluracil) prevents catabolism of FU. Hypothesizing that suppression of catabolism would enhance PET/[18F]FU, we examined the effects of eniluracil on the short-term pharmacokinetics of the radiotracer. Methods: Anesthetized rats bearing a subcutaneous rat colorectal tumor were given eniluracil or placebo and injected intravenously 1 h later with [18F]FU or [3H]FU. In the 18F studies, dynamic PET image sequences were obtained 0–2 h after injection. Tumors were excised and frozen at 2 h and then analyzed for labeled metabolites by high-performance liquid chromatography. Biodistribution of radiolabel was determined by direct tissue assay. Results: Eniluracil improved tumor visualization in PET images. With eniluracil, tumor standardized uptake values ([activity/g]/[injected activity/g body weight]) increased from 0.72 ± 0.06 (mean ± SEM; n = 6) to 1.57 ± 0.20 (n = 12; P < 0.01), and tumor uptake increased by factors of 2 or more relative to plasma (P < 0.05) and bone, liver, and kidney (P < 0.01). Without eniluracil (n = 5), 57% ± 4% of recovered radiolabel in tumor at 2 h was on catabolites, with the rest divided among FU (2% ± 1%), anabolites of FU (38% ± 7%), and unidentified peaks (4% ± 2%). With eniluracil (n = 8), catabolites, FU, and anabolites comprised 2% ± 1%, 41% ± 5%, and 57% ± 4%, respectively, of the recovered radiolabel in tumors. Conclusion: Eniluracil increased tumor accumulation of 18F relative to host tissues and fundamentally changed the biochemical significance of that accumulation. With catabolism suppressed, tumor radioactivity reflected the therapeutically relevant aspect of FU pharmacokinetics—namely, uptake and anabolic activation of the drug. With this approach, it may be feasible to measure the transport and anabolism of [18F]FU in tumors by kinetic modeling and PET. Such information may be useful in predicting and increasing tumor response to FU.
Cancer chemotherapy is hindered by lack of quantitative information about drug behavior in tumors and dose-limiting host tissues of individual patients. As a result, patients are usually treated according to standardized drug regimens that are often ineffective or prohibitively toxic (or both) in the individual case. There is a great need to develop accurate and widely applicable methods for predicting whether patients will respond to a given therapy, optimizing therapeutic regimens for individual patients, and measuring the effectiveness of therapy. PET provides one means by which this might be achieved. Conventional PET imaging with FDG may be useful for monitoring tumor response to chemotherapy (1). However, tumor accumulation of FDG reflects intermediary metabolism, whereas measurement of the pharmacokinetics of chemotherapeutic drugs is required for optimization of treatment regimens and prediction of response.
Relatively few chemotherapeutic drugs have been labeled with positron-emitting radionuclides, and the general usefulness of PET for measuring drug pharmacokinetics remains in question (2,3). A key limitation for some important chemotherapeutic agents, such as 5-fluorouracil (FU), is their rapid biochemical transformation in vivo. Because PET cannot directly discriminate among different radiolabeled molecular species, the significance of the images is obscured in the presence of significant amounts of recirculating, radiolabeled metabolites of the injected compound. We are attempting to eliminate this problem in the case of [18F]FU by using biochemical modulation to prevent catabolism of the radiotracer.
FU is used by itself or in combination with other drugs to treat nonresectable disease in several common cancers, especially carcinomas of the colon and breast. This synthetic pyrimidine nucleobase arrests cell proliferation by blocking thymidylate synthase (TS), the enzyme that catalyzes de novo synthesis of the DNA precursor thymidylate (i.e., thymidine monophosphate); forming defective, fluorinated RNA (F-RNA), which ultimately interferes with protein synthesis; and forming defective, fluorinated DNA (F-DNA), which results in single-strand breaks and DNA fragmentation (4–7). FU is toxic only when taken up by cells and anabolized (phosphorylated) to fluoronucleotides, which in turn may be incorporated into nucleic acids or bind to TS (Fig. 1). The bioavailability of FU is greatly limited by rapid catabolism, which occurs primarily in the liver. After intravenous injection in humans, the drug has a half-life in blood of only 8–20 min (8).

Metabolism of FU. DPD = dihydropyrimidine dehydrogenase; FUH2 = dihydrofluorouracil; FUPA = α-fluoro-β-ureido-propanoic acid; FBAL = α-fluoro-β-alanine; BAL = β-alanine; F− = fluoride ion; FdUrd = fluorodeoxyuridine; FUrd = fluorouridine; FdUMP, FdUDP, and FdUTP = fluorodeoxyuridine mono-, di-, and triphosphate, respectively; FUMP, FUDP, and FUTP = fluorouridine mono-, di-, and triphosphate, respectively; TS, thymidylate synthase; F-DNA and F-RNA = fluorinated DNA and RNA, respectively; CH2FH4 = 5,10-methylene tetrahydrofolate. (Note that “F” in CH2FH4 symbolizes folate, not fluorine (6). Chemical structures of FU and its metabolites can be found in (4) and (7).)
Although objective response rates are only on the order of 10%–30%, FU remains one of the most widely used chemotherapeutic agents (5,9). A major reason for the continued interest in FU is the availability of various modulating agents that, in principle, can be used to manipulate the metabolism of FU to increase tumor cytotoxicity relative to normal tissues. One such biomodulator of current interest is eniluracil (5-ethynyluracil or compound 776C85; Glaxo Wellcome, Inc., Research Triangle Park, NC), a potent, mechanism-based, irreversible inactivator of dihydropyrimidine dehydrogenase (DPD), the enzyme that catalyzes the first step in the catabolism of uracil and fluorouracil (Fig. 1) (10). Eniluracil differs chemically from FU by replacement of the fluorine atom with an ethynyl group (C–C≡H) at the 5 position of the pyrimidine ring. Inactivation of DPD increases the usefulness of FU by increasing the lifetime of FU in the circulation and its incorporation by tumors, by preventing catabolism of FU in tumors that express DPD, and by enabling reliable oral administration of FU (11,12).
It may be possible to measure the pharmacokinetics of FU in tumors and normal tissues by PET imaging of [18F]FU (PET/[18F]FU). The importance of quantifying FU pharmacokinetics is indicated by studies showing correlation between clinical response and trapping of free FU in tumors as measured by nuclear magnetic resonance spectroscopy (NMRS) (13). Because of its far greater sensitivity, PET has potential advantages over NMRS for measuring FU kinetics in vivo. However, PET/[18F]FU is hampered by at least two problems: low tumor uptake of the radiolabel and rapid catabolism of [18F]FU, which obscures interpretation of the PET images (14,15). We hypothesize that these two difficulties can be alleviated using eniluracil to prevent the catabolism of [18F]FU.
A key issue affecting the potential usefulness of the proposed PET/[18F]FU + eniluracil technique is whether the anabolic kinetics of FU in tumors are altered in the presence of eniluracil. To our knowledge, no direct investigations of this matter have been reported. The existing evidence suggests that eniluracil has little, if any, direct effect on the anabolic pharmacokinetics of FU in tumors (11,12,16,17), but that suppression of catabolites may enhance the antitumor activity of FU (18). If the anabolic kinetics of FU were substantially altered in the presence of eniluracil, then use of PET/[18F]FU + eniluracil might be limited to treatment regimens that combine FU with eniluracil. This matter is examined more fully in the Discussion.
This article summarizes our preliminary study of the effects of eniluracil on the biodistribution and metabolism of [18F]FU in a rat colorectal tumor model (Ward tumor). The period of observation (0–2 h after injection) was chosen to approximate the longest practical duration of a clinical PET procedure. The results of the study show that eniluracil was highly effective in preventing systemic catabolism, which led to increased tumor anabolism of [18F]FU and improved tumor visualization with PET.
MATERIALS AND METHODS
Chemicals and Radiotracers
Eniluracil was supplied under special agreement by Glaxo Wellcome. [18F]FU was prepared according to a published, one-pot synthesis (19,20). The radiochemical purity of the final product as determined by high-performance liquid chromatography (HPLC) was 98%, and the specific activity ranged from 15 to 22 GBq/mmol (400–600 mCi/mmol, or 3–5 mCi/mg). Tritium-labeled FU (5-[6-3H]FU, 5.7 × 10² GBq/mmol, radiochemical purity > 98%) was purchased from Moravek Biochemical (Brea, CA). [18F]F−, prepared through the nuclear reaction 18O(p,n)18F,was used to identify free fluoride ion in radiochromatograms.Nonradiolabeled chemicals used as references for identification of radiolabeled chromatographic peaks were purchased from Sigma (St. Louis, MO) with chemical purities as indicated in parentheses in the following lists: FU (99%), 5-fluorouridine (FUrd; 99%), 5-fluoro-2′-deoxyuridine (FdUrd; 99%), fluorodeoxyuridine monophosphate (FdUMP; 85%), uridine 5′-diphosphate (UDP; 96%), and uridine 5′-triphosphate (UTP; 97%). Fluorouridine monophosphate (FUMP; >99%), fluorouridine triphosphate (FUTP; >97%), and fluorodeoxyuridine triphosphate (FdUTP, >97%) were obtained as special preparations from Sierra Bioresearch (Tucson, AZ).
Rat Tumor Model
Studies were performed in female Fischer-344 albino rats (180–210 g) obtained from Simonsen Laboratories (Gilroy, CA). The rats were implanted with the Ward tumor, a chemically induced colorectal carcinoma (21). The response of this tumor to FU is very similar to that of human colorectal carcinoma. The Fischer rat–Ward tumor model has been used to study the effects of several different FU analogs and biochemical modulators of FU (22,23).
Several small pieces (about 1 mm3 each) of either previously frozen tumor or fresh tumor from a donor rat were implanted by trochar injection between the skin and gastrocnemius muscle. The implanted tumors reached 0.5 g in 12–20 d, grew in a well-encapsulated manner, and appeared to derive their blood supply from the overlying skin. Macroscopic, central necrosis began to appear when the tumors reached 1 g. Studies were performed with tumors weighing 0.2–2.8 g (mean, 0.64 g).
All in vivo procedures were performed in accordance with protocols approved by the University of Southern California Animal Care and Use Committee. The rats were fed Purina Rat Chow (Ralston Purina Co., St. Louis, MO), given water ad libidum, and maintained on a 12-h light–12-h dark cycle. Anesthesia was induced by intraperitoneal injection of ketamine (80 mg/kg) plus xylazine (5 mg/kg) and maintained with smaller doses as needed. The rats were allowed to breathe spontaneously without intubation. Arterial blood gases remained normal for >3 h with this regimen. Vascular access was obtained by surgical cutdown and cannulation of one jugular vein and, in some cases, one carotid artery with 24-gauge, intravenous catheters. The rats were killed by intravenous injection of pentobarbital.
Blood sampling for determination of arterial plasma time–activity curves presented a particular challenge because of the small blood volume of the rats and the need to minimize cross-contamination among samples. Discrete samples were drawn manually from the carotid artery through a catheter consisting of a special, small-bore, male–male adapter; PE-50 tubing (Fisher Scientific, Springfield, NJ) fitted at either end with a blunted 23-gauge hypodermic needle; and 3-way stopcock. The catheter (internal volume, 0.35 mL) was filled by withdrawing 0.7 mL blood with a 1 mL syringe, and the sample (0.2 mL for activity concentration measurements or 0.6 mL for metabolite analysis) was then removed through the side port of the stopcock. The contents of the fill syringe were reinjected, the fill syringe was replaced with a flush syringe, and the line was flushed with a volume of heparinized saline (0.55 or 0.95 mL) equal to the combined volumes of the catheter and blood sample. This technique was shown to provide accurate measurements of blood activity concentration in an artificial model. The rats readily tolerated a sampling schedule that provided enough data points to adequately characterize the plasma time–activity curve and enough blood to test for circulating metabolites. Large-vessel hematocrit declined linearly with cumulative blood removal (y = 44 − 0.47x [P ≤ 0.01], where y = % hematocrit and x = cumulative volume removed/body weight [mL/kg]). The rats consistently survived the procedure when hematocrit remained above 32%.
Pharmacokinetic Studies
Imaging studies were performed with a model 953A PET scanner (CTI/Siemens, Inc., Knoxville, TN) (31 transaxial planes, 43-cm-diameter transaxial field of view, 10.8-cm axial field of view, 5-mm intrinsic resolution in all three dimensions). The anesthetized, tumor-bearing rat was bound to a surgery board made of thin plastic. The rat was then injected intraperitoneally with eniluracil (1 mg/kg) or saline placebo. After catheterization, the rat and surgery board were centered transaxially within the scanner's field of view and secured to a specially designed Lucite shelf. With this orientation, the tomograph provided whole-body images of the rats (Fig. 2). After a transmission scan, 18F marker sources were taped over the tumors and imaged to aid identification of tumors in the [18F]FU study. The marker sources were then removed and, about 1 h after the eniluracil or placebo injection, a dynamic emission scan was started as the rat was injected through the jugular catheter with 70–110 MBq (2–3 mCi) [18F]FU (5 mg/kg). Injected active volume, flush volume, and injection rate were 1.0 mL, 1.0 mL, and 0.5 mL/min, respectively. Dynamic imaging continued for 2 h (45 frames: 1 × 30 s, 9 × 10 s, 11 × 30 s, 12 × 2 min, 6 × 5 min, 6 × 10 min). Arterial blood samples (12 or 13 total) were drawn at increasing intervals during the course of the imaging study.
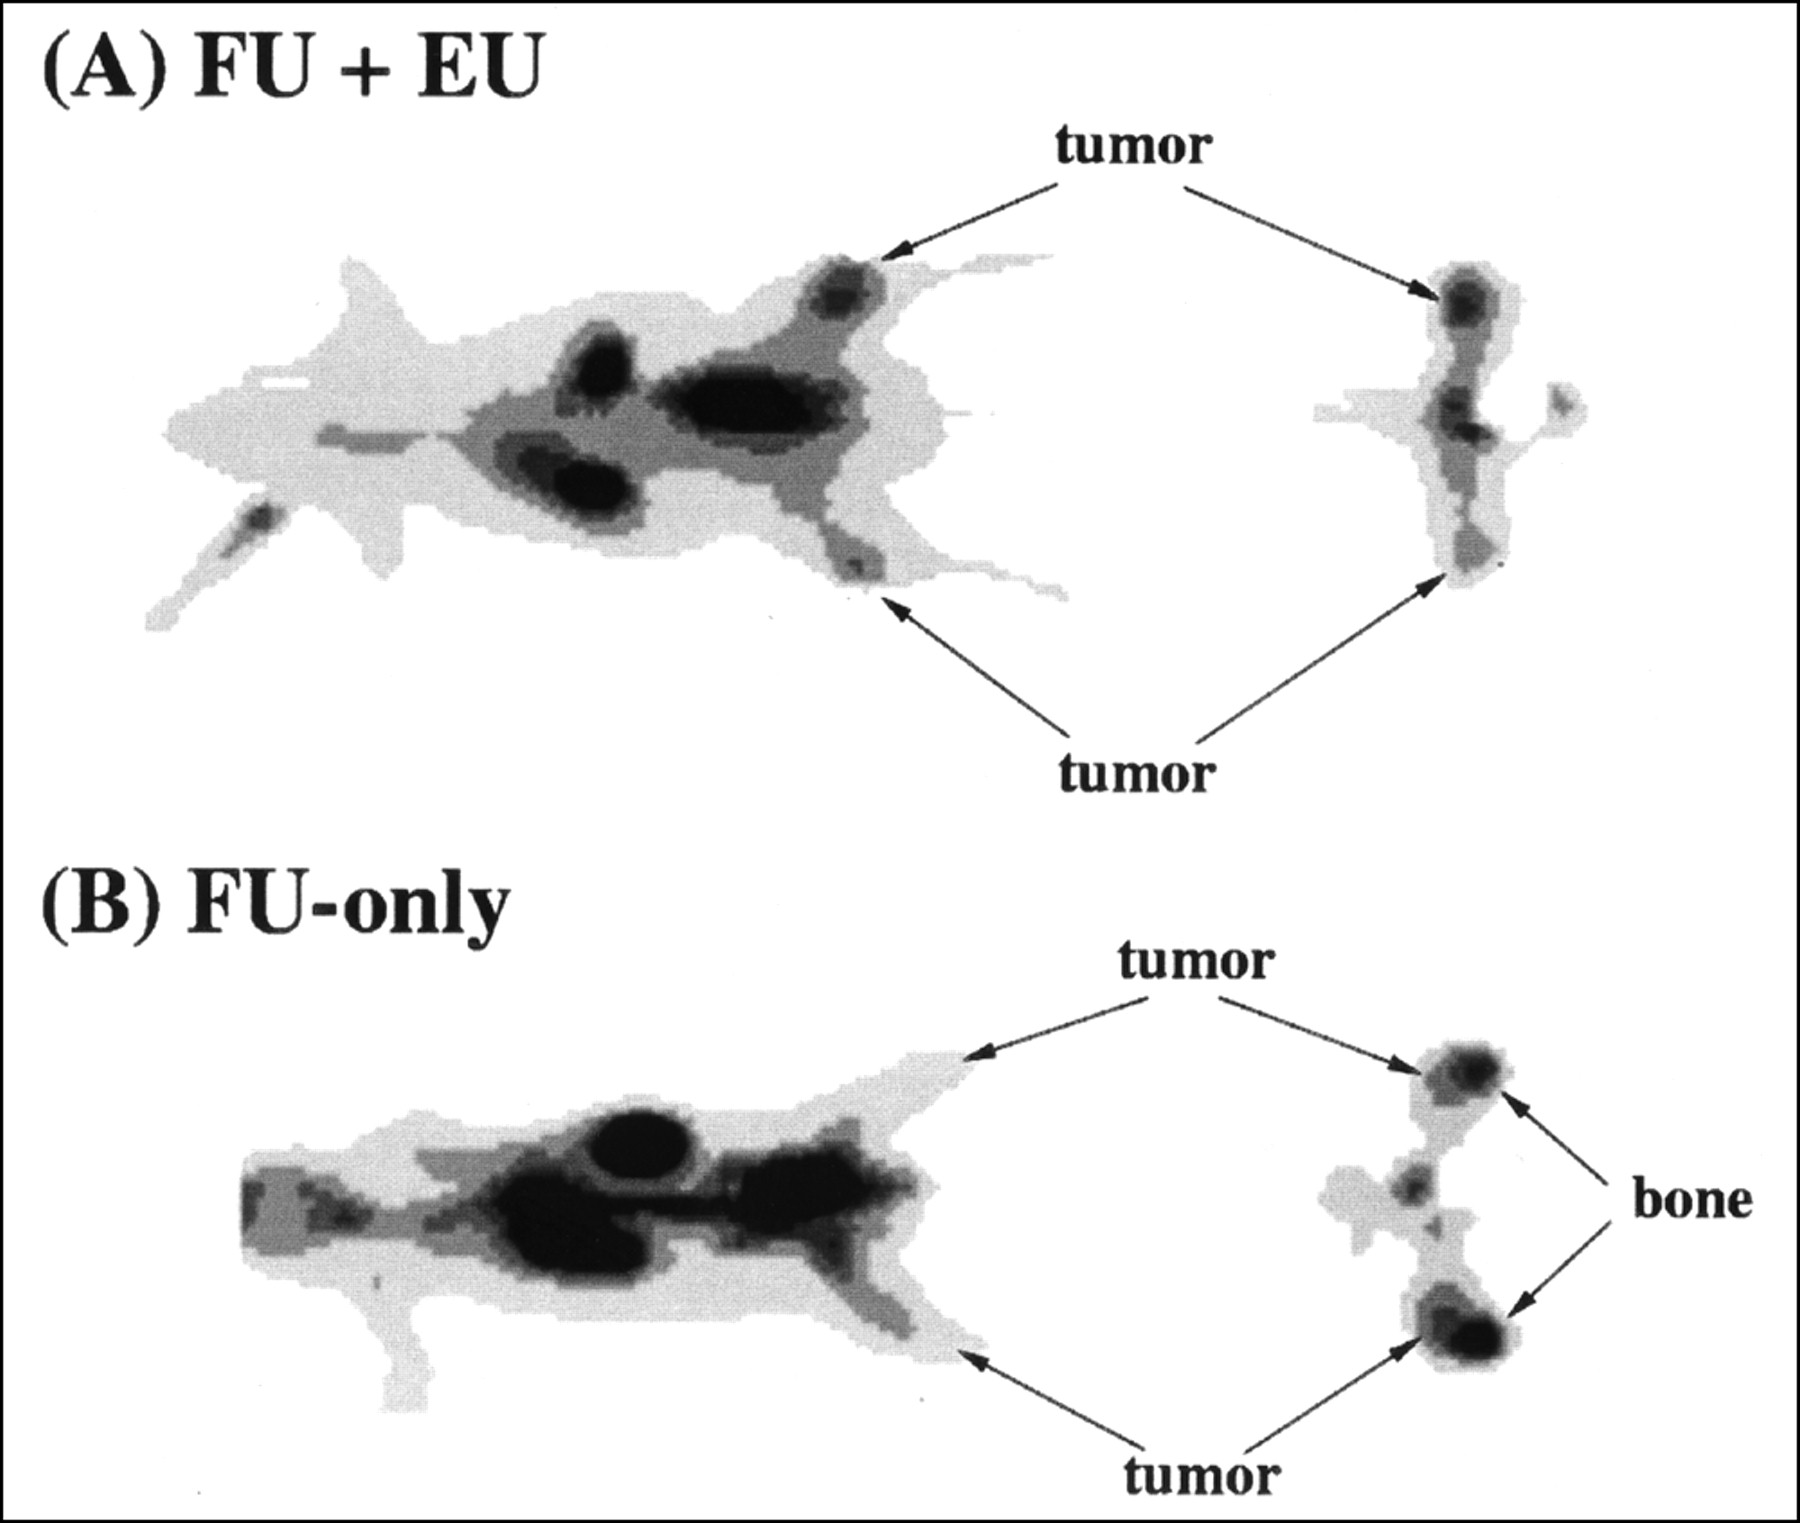
Effect of eniluracil (EU) on tumor visualization. Images are thin anteroposterior coronal and transaxial slices through tumors 110–120 min after intravenous injection of [18F]FU (FU). Spatial resolution of reconstructed images is 6–7 mm FWHM in the transaxial plane and 6 mm in the axial dimension. Tumor locations were verified by 18F marker images. Tumor weights and standardized uptake values (SUVs) were determined by direct measurements on excised tissues. (A) Tumors in legs (left [upper]: 1.3 g, SUV 1.05; right: 0.32 g, SUV 1.57) are clearly visualized relative to adjacent normal tissues. (B) Tumors (left: 0.22 g, SUV 0.61; right: 0.43 g, SUV 0.67) are less distinguishable, attributed in part to elevated bone uptake of 18F.
Three studies included imaging and ex vivo measurement of tissue 18F concentrations, but not metabolite analysis. In each of the other studies with [18F]FU, one or two blood samples were analyzed for molecular distribution of the radiolabel in plasma. At the end of the dynamic imaging procedure in those studies, the tumors were rapidly excised and frozen between blocks of dry ice to arrest metabolism. Frozen tumors were transferred to prechilled plastic tubes and kept immersed in liquid nitrogen until they were prepared for metabolite analysis, except for brief intervals during which the samples were weighed and counted to determine total activity concentrations. After tumor excision and freezing, the rats were killed, and samples of various normal tissues and organs were taken for measurement of radioactivity concentration.
In four studies, [3H]FU was used instead of [18F]FU, and no images were obtained. The injected radioactivity dose of 3H (about 2 MBq) was computed as the weight of fluid injected × the activity concentration of the injectate. Nonradioactive FU was added to make the injected dose of the drug (2 mg/kg) similar to that in the [18F]FU studies.
Ex Vivo Assay Procedures
Tissue and HPLC samples were measured for 18F activity in a γ counter (Packard Instruments, Meriden, CT) calibrated periodically against the same ion chamber–type dose calibrator (Capintec, Ramsey, NJ) used to assay [18F]FU injected into the rats. In studies with 3H, tissue samples were dissolved in 5% sodium dodecyl sulfate plus 0.1N NaOH and decolorized with hydrogen peroxide. Tissue and HPLC samples were assayed in a model LS9000 liquid scintillation counter (Beckman Instruments, Fullerton, CA), using the external standard method of quench correction.
Blood samples were immediately placed in ice and then centrifuged. An aliquot of plasma was removed from each sample, weighed, and counted for radioactivity. In samples drawn for metabolite analysis, the remaining plasma was prepared for HPLC analysis by acid extraction with 1N perchloric acid (PCA) and neutralization with KOH (4 mol/L). The acid-insoluble fraction (AIF) was shown in several early studies to contain negligible activity. The acid-soluble fraction (ASF) was analyzed by ion-pair HPLC using a C8 reversed-phase analytic column (Waters, Milford, MA) (particle size 10 μm; column dimensions, 8 × 100 mm; Radial Pak cartridge in RCM 8 × 10 holder) and isocratic elution. The mobile phase consisted of 5% acetonitrile in 20 mmol/L phosphate buffer containing 2.5 mmol/L tetrabutylammonium hydroxide (pH 6.5), and the flow was 1.0 mL/min. Eluents were passed through an in-line ultraviolet (UV) detector (Waters, Milford, MA) and an in-line radiation detector (Magen Scientific Corp., New York, NY); eluted fractions were also collected and assayed for radioactivity. Catabolites, FU, and fluoronucleosides eluted within 10 min (Fig. 3).

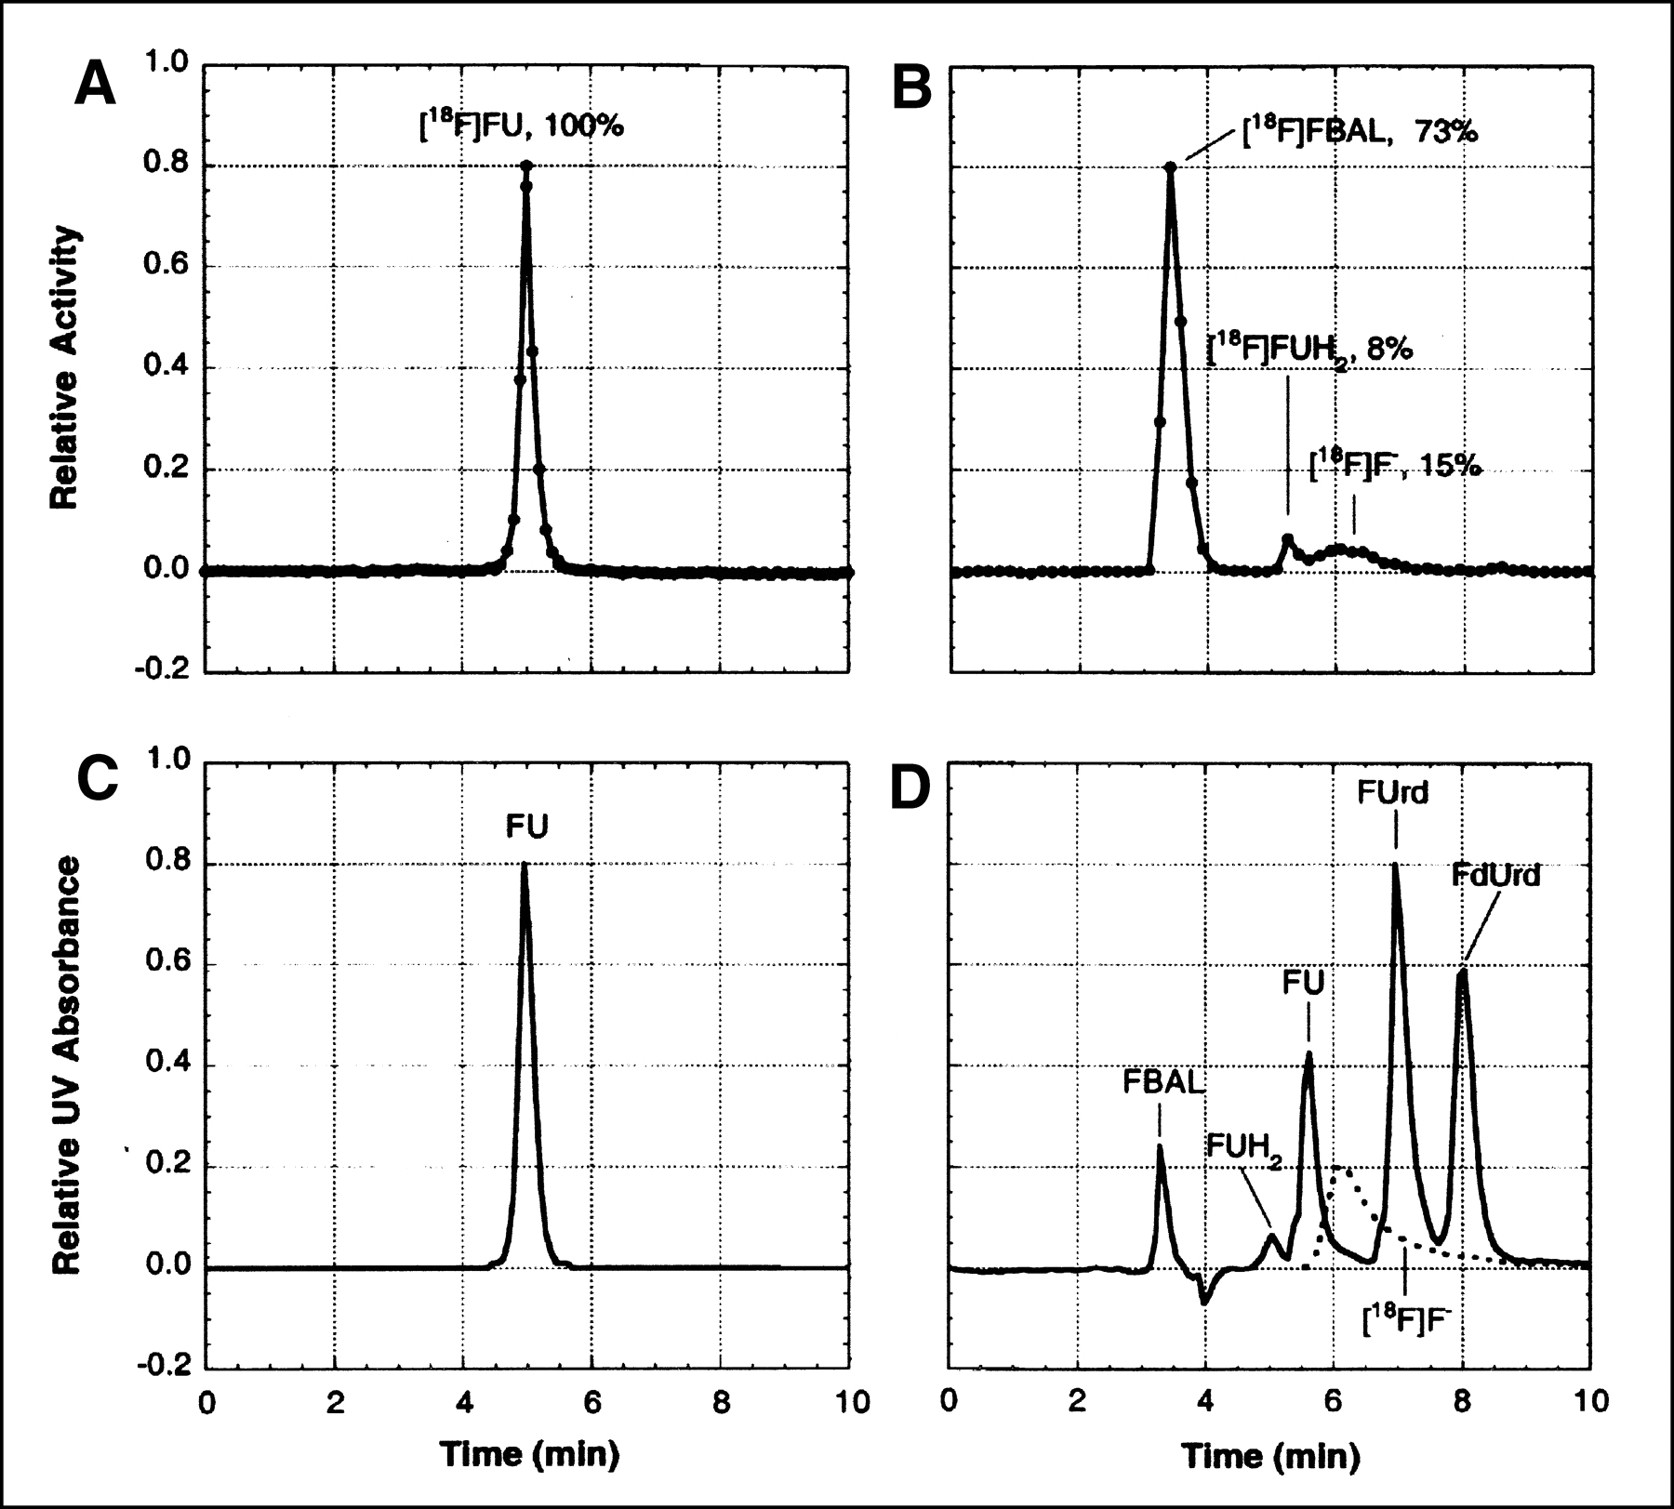
Analysis of 18F-labeled metabolites in arterial plasma. (A and B) Radiochromatograms obtained by isocratic-elution HPLC of acid-soluble extract from samples taken 90 min after intravenous injection of [18F]FU into a rat pretreated with eniluracil (A) and 60 min after intravenous injection of [18F]FU into a rat not pretreated with eniluracil (B). (C) UV absorbance chromatogram (wavelengths ≥ 254 nm) of an authentic sample of FU, which was obtained just before the radiochromatogram of (A). (D) UV absorbance chromatogram (wavelengths ≥ 214 nm) recorded simultaneously with radiochromatogram of (B). An aliquot of solution containing authentic, nonradiolabeled samples of α-fluoro-β-alanine (FBAL), dihydrofluorouracil (FUH2), FU, fluorouridine (FUrd), and fluorodeoxyuridine (FdUrd) was added to the injectate in the run depicted in (B and D). Radiochromatogram for 18F-labeled fluoride ion ([18F]F−) (dashed lines in D) was determined separately. Percentages of recovered radiolabel associated with various peaks are shown in (A and B).
Frozen tumors were immersed in liquid nitrogen together with 5N PCA (1:1 volume per weight (v/w) of tumor) and ground into a fine powder. Two hundred fifty to 400 mg of the powder were thawed on ice with periodic, rapid mixing over a 10-min period. Ice-cold, deionized, distilled water was added (1.5:1 v/w), and the acid-soluble supernate and pellet were separated by microcentrifugation. The AIF (i.e., the pellet) was rinsed twice with ice-cold 1N PCA and assayed for radioactivity. The ASF was buffered with K2HPO4 (1 mol/L, 1:20 volume per volume (v/v)) and then neutralized with KOH (4 mol/L). The resulting perchlorate salt was removed by centrifugation.
The desalted ASF was analyzed by ion-pair HPLC using a reversed-phase, C18column (Microsorb-MV; Rainin Instruments, Woburn, MA) (particle size 5 μm; column dimensions, 4.6 × 250 mm) and multistep, linear-gradient elution. The mobile phase was formed by mixing solvent A (1.5 mmol/L ammonium phosphate, 1 mmol/L tetrabutyl ammonium phosphate [pH 3.3], and 1% [v/v] acetonitrile) and solvent B (25 mmol/L ammonium phosphate, 1 mmol/L tetrabutylammonium phosphate [pH 3.3], and 30% [v/v] acetonitrile) at a combined flow of 1.0 mL/min according to the following schedule: 0 min, A = 100%; 15 min, A = 67%; 25 min, A = 10%; and 30 min, A = 0%. With this system, nucleobases, nucleosides, and mono-, di-, and triphosphate nucleotides were eluted as individual peaks within 30 min (Fig. 4).

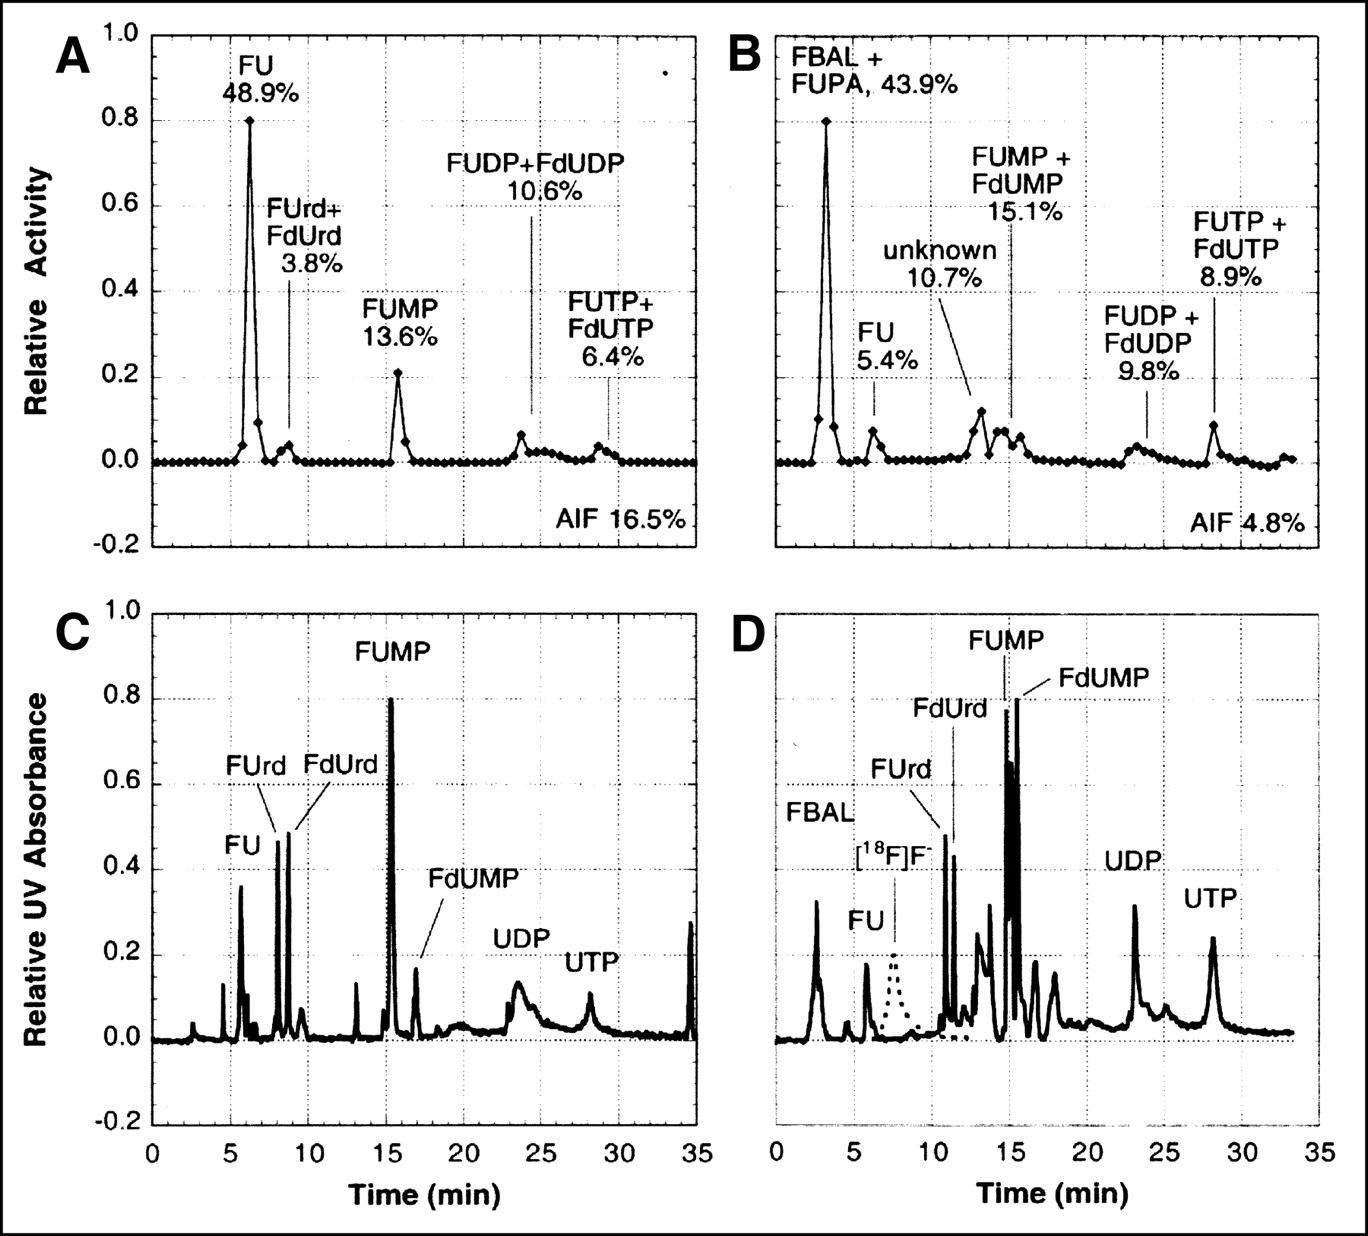
Analysis of 18F-labeled metabolites in tumors. Shown are radiochromatograms (A and B) and corresponding UV chromatograms (C and D) obtained by gradient-elution HPLC of acid-soluble extract from Ward tumors. Tumors were harvested 2 h after intravenous injection of [18F]FU from rats pretreated with eniluracil (A and C) and not pretreated with eniluracil (B and D). UV absorption was measured for wavelengths ≥ 214 nm. Percentages of radiolabel in each peak, as well as in the AIF, are indicated in (A and B). Aliquots of solutions containing authentic, nonradiolabeled samples of compounds indicated in the UV chromatograms were added to tumor extracts before injection for HPLC. FUrd = fluorouridine; FdUrd = fluorodeoxy-uridine; FUMP, FUDP, and FUTP = fluorouridine mono-, di-, and triphosphate, respectively; FdUMP, FdUDP, and FdUTP = fluorodeoxyuridine mono-, di-, and triphosphate, respectively; AIF = acid-insoluble fraction; FBAL = α-fluoro-β-alanine; FUPA = α-fluoro-β-ureido-propanoic acid; UDP = uridine diphosphate; UTP = uridine triphosphate; F− = fluoride ion. Standard chromatogram for [18F]F− (dashed lines in D) was determined separately. There was no evidence of free [18F]F− in studies shown.
Radiolabeled peaks were identified in reference to UV absorption chromatograms of standard solutions containing authentic, nonradiolabeled counterparts of the various metabolites expected in the experimental samples (Figs. 3 and 4). Elution times differed negligibly among FUTP, FdUTP, and UTP. Hence, UTP, which is relatively inexpensive, was used in place of the triphosphate fluoronucleotides in most studies. Similarly, UDP was used as a standard for the fluorinated diphosphate nucleotides because a radioactive peak coinciding with UDP was observed consistently for tumors (Fig. 4). Twenty microliters of the standard solution were added to 220 μL desalted ASF. Two hundred microliters of this mixture were injected onto the HPLC column, and eluted fractions (30 s each) were collected and assayed for radioactivity. An aliquot of the HPLC injectate was weighed and counted for use in estimating recovery of injected activity during HPLC. The fraction of recovered activity associated with a given molecular species was multiplied by the percentage of total activity in the ASF to determine the overall percentage of that molecular species in the original experimental sample. Because they were not well separated in some runs, ribonucleic and deoxyribonucleic species were not differentiated in the quantitative analysis of the chromatograms.
Image Processing and Statistical Analysis
Raw data from the PET/[18F]FU studies were corrected for random coincidence noise, scanner dead time, photon attenuation, and radioactive decay. Images were reconstructed (image matrix, 128 × 128; zoom factor, 2.0; pixel width, 1.7 mm) by filtered backprojection using a Hann filter with a frequency cutoff factor of 0.5 cycle/pixel. Time–activity curves were obtained from small, circular regions of interest centered well within the boundaries of visualized tumors, organs, and skeletal muscle to minimize count spillover from adjacent tissues. The curves were normalized at 2 h to activity concentrations measured directly in excised tissues.
All time–activity curves and tissue activity concentrations were normalized to injected activity/body weight and thus expressed as standardized uptake values (SUVs). (SUV = [radioactivity/g tissue] ÷ [radioactivity injected/g body weight].) Tumor contents of FU and its various metabolites were expressed as percentages of radioactivity recovered during the metabolite analysis procedure.
Total radioactivity in the urinary bladder at 2 h after injection was computed by multiplying directly measured activity concentration in urine by the bladder volume as estimated from the final frame of the PET dynamic study. The boundary of the bladder was defined to coincide with the 40% isocontour of the bladder image.
Statistical analysis was performed with the software package JMP (SAS Institute, Inc., Cary, NC). The application of conventional, parametric statistical analysis requires that data be normally distributed with constant variance (stationarity) among different groups. The tissue activity concentration and metabolite data did not meet these criteria. Normal distribution and stationarity of variance were restored for the tissue SUVs and tumor-to-tissue SUV ratios by logarithmic transformation, but neither condition was restored for the metabolite percentage of activity data by either logarithmic or square root transformation. Thus, means were compared for logarithmically transformed tissue SUVs and tumor-to-tissue SUV ratios by the Student t test, whereas the nonparametric Wilcoxon rank sum test was used for metabolite percentages of activity. Differences were considered to be statistically significant at the 5% level of probability.
RESULTS
Pretreatment of the rats with eniluracil improved tumor imaging with [18F]FU and PET (Fig. 2). Although uptake of 18F in muscle increased with eniluracil (Table 1), tumors consistently were visualized better relative to normal tissues of the hind legs when catabolism was suppressed. Accumulation of 18F in the bones of the legs interfered with tumor identification and quantification of tumor activity concentration from images in the FU-only studies. On the other hand, tumors appeared to be hot relative to other leg tissues in all imaging studies with [18F]FU and eniluracil.
Effect of Eniluracil (EU) on Biodistribution of Radiolabel in Tumor-Bearing Rats 2 Hours After Intravenous Injection of [18F]FU or [3H]FU
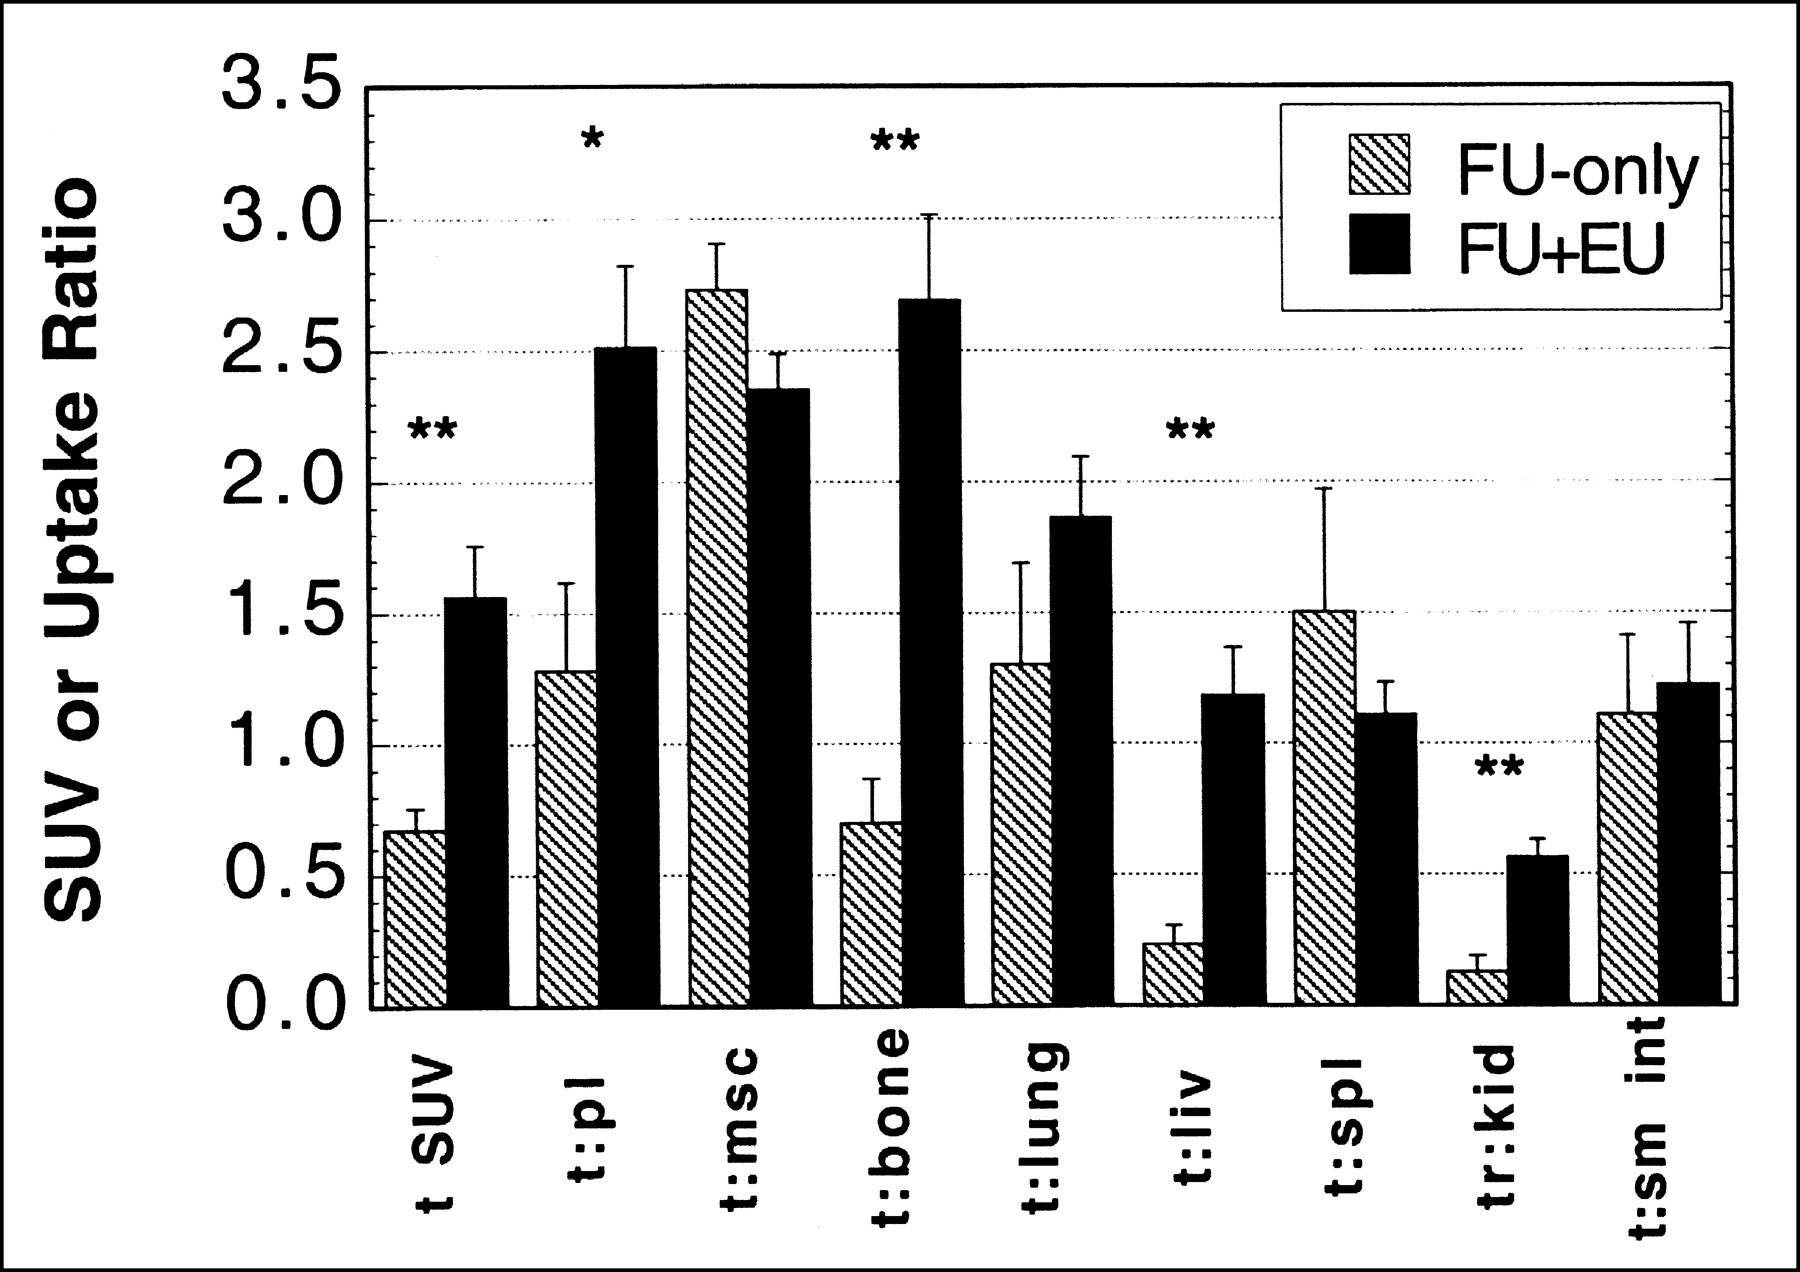
The effect of eniluracil on the biodistribution of 18F at 2 h after injection is summarized in Table 1 and Figure 5. Tumor SUV approximately doubled with eniluracil modulation. Uptake in spleen and skeletal muscle (and perhaps small intestine as well) also increased with eniluracil, whereas that in bone, liver, and kidney decreased (Table 1). Eniluracil was associated with significant increases in tumor activity concentration relative to plasma, bone, liver, and kidney when computed on an intra-animal basis (Fig. 5). There were no statistically significant decreases in tumor activity concentration relative to any of the normal tissues examined. Clearance of 18F into the bladder was similar with and without eniluracil (43% ± 5% [n = 4] and 32% ± 5% [n = 2], respectively, of total body activity at 2 h).

Effect of eniluracil (EU) on tissue distribution of radiolabel from [18F]FU (FU) at 2 h after injection. For tumor SUVs, n = 4 for FU-only; n = 12 for FU + EU. For tumor-to-normal tissue ratios, n = 2 for FU-only; n = 5 for FU + EU. Error bars indicate SEMs. *P < 0.05; **P < 0.01. t = tumor; pl = plasma; msc = muscle; liv = liver; spl = spleen; kid = kidney; sm int = small intestine.
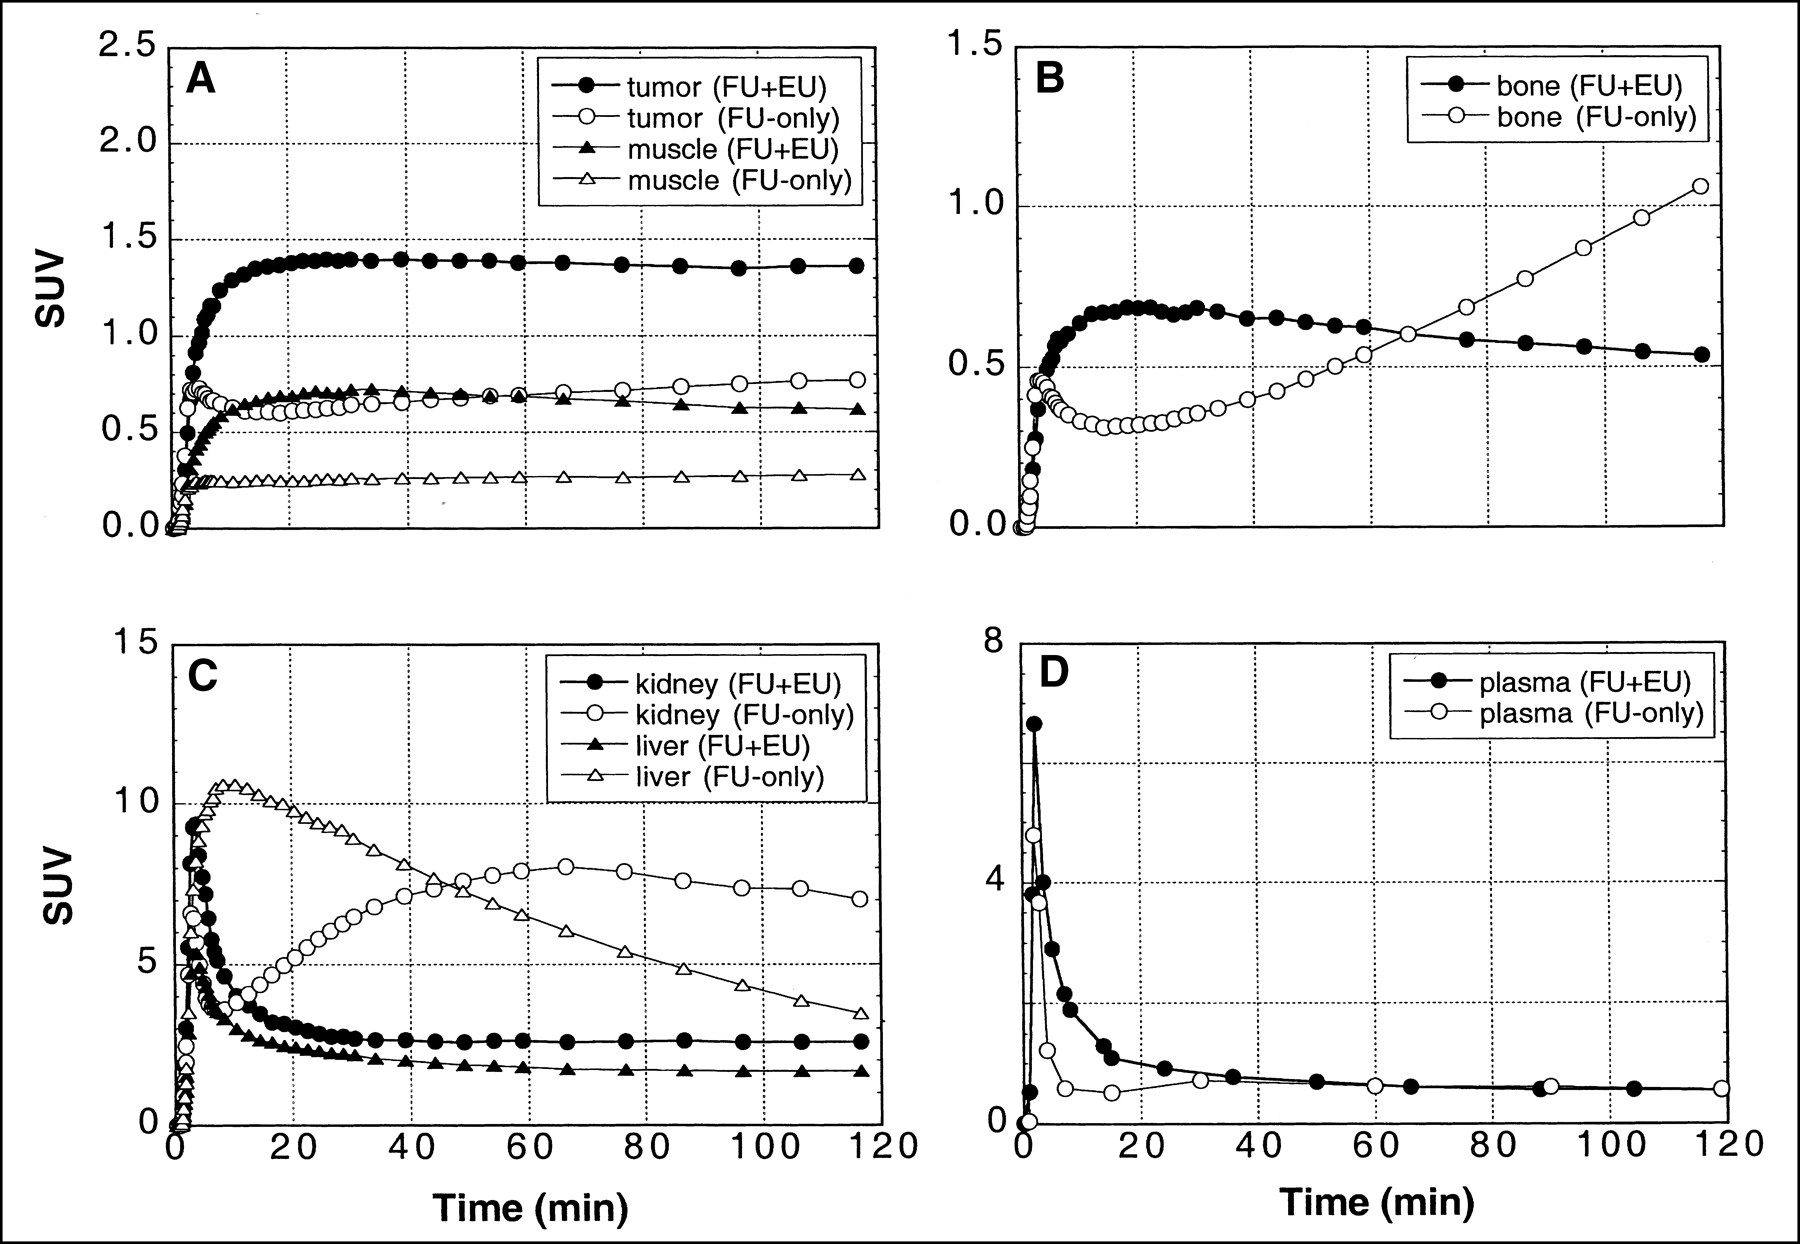
Eniluracil had a marked effect on relative tissue uptake of 18F versus time—that is, on the shapes of time–activity curves—in tumors as well as normal tissues and organs. When [18F]FU was given without the blocker, there was a redistribution of radiolabel to tumors, muscle, bone, and kidney beginning10–20 min after injection (Fig. 6). Eniluracil eliminated these secondary increases, which presumably were caused by accumulation of 18F-labeled catabolites. Conversely, comparison of the time–activity curves for liver suggests that eniluracil inhibited initial accumulation and subsequent release of radiolabel associated with conversion of [18F]FU to labeled catabolites. Initial clearance of radiolabel from plasma was less rapid with than without eniluracil, but, in the absence of the blocker, there was a secondary increase (presumably associated with catabolites) in plasma radiolabel concentration beginning at about 20 min (Fig. 6D).

Effect of eniluracil (EU) on 18F time–activity curves in tissues, organs, and arterial plasma after intravenous injection of [18F]FU (FU). Tissue and organ time–activity curves (A–C; n = 4 and 2 for FU + EU and FU-only, respectively) were extracted from PET images, whereas plasma curves (D; n = 5 and 2 for FU + EU and FU-only, respectively) were obtained by direct arterial sampling. Tissue and organ data were normalized at the final time point to values obtained by ex vivo assay of excised tissue samples obtained after killing at 2 h. Data are expressed in terms of SUV. Note that ordinate scales differ in (A–D).
Results of the metabolite analyses for plasma are presented in Figure 3 and Table 2. In studies with [18F]FU and eniluracil, essentially all circulating radiolabel was on FU during the first 90 min after injection (the latest sampling time used). In studies without the blocker, on the other hand, most of the radiolabel in plasma at 1 and 2 h was associated with catabolites.
Molecular Distribution of Radiolabel in Plasma After Intravenous Injection of FU
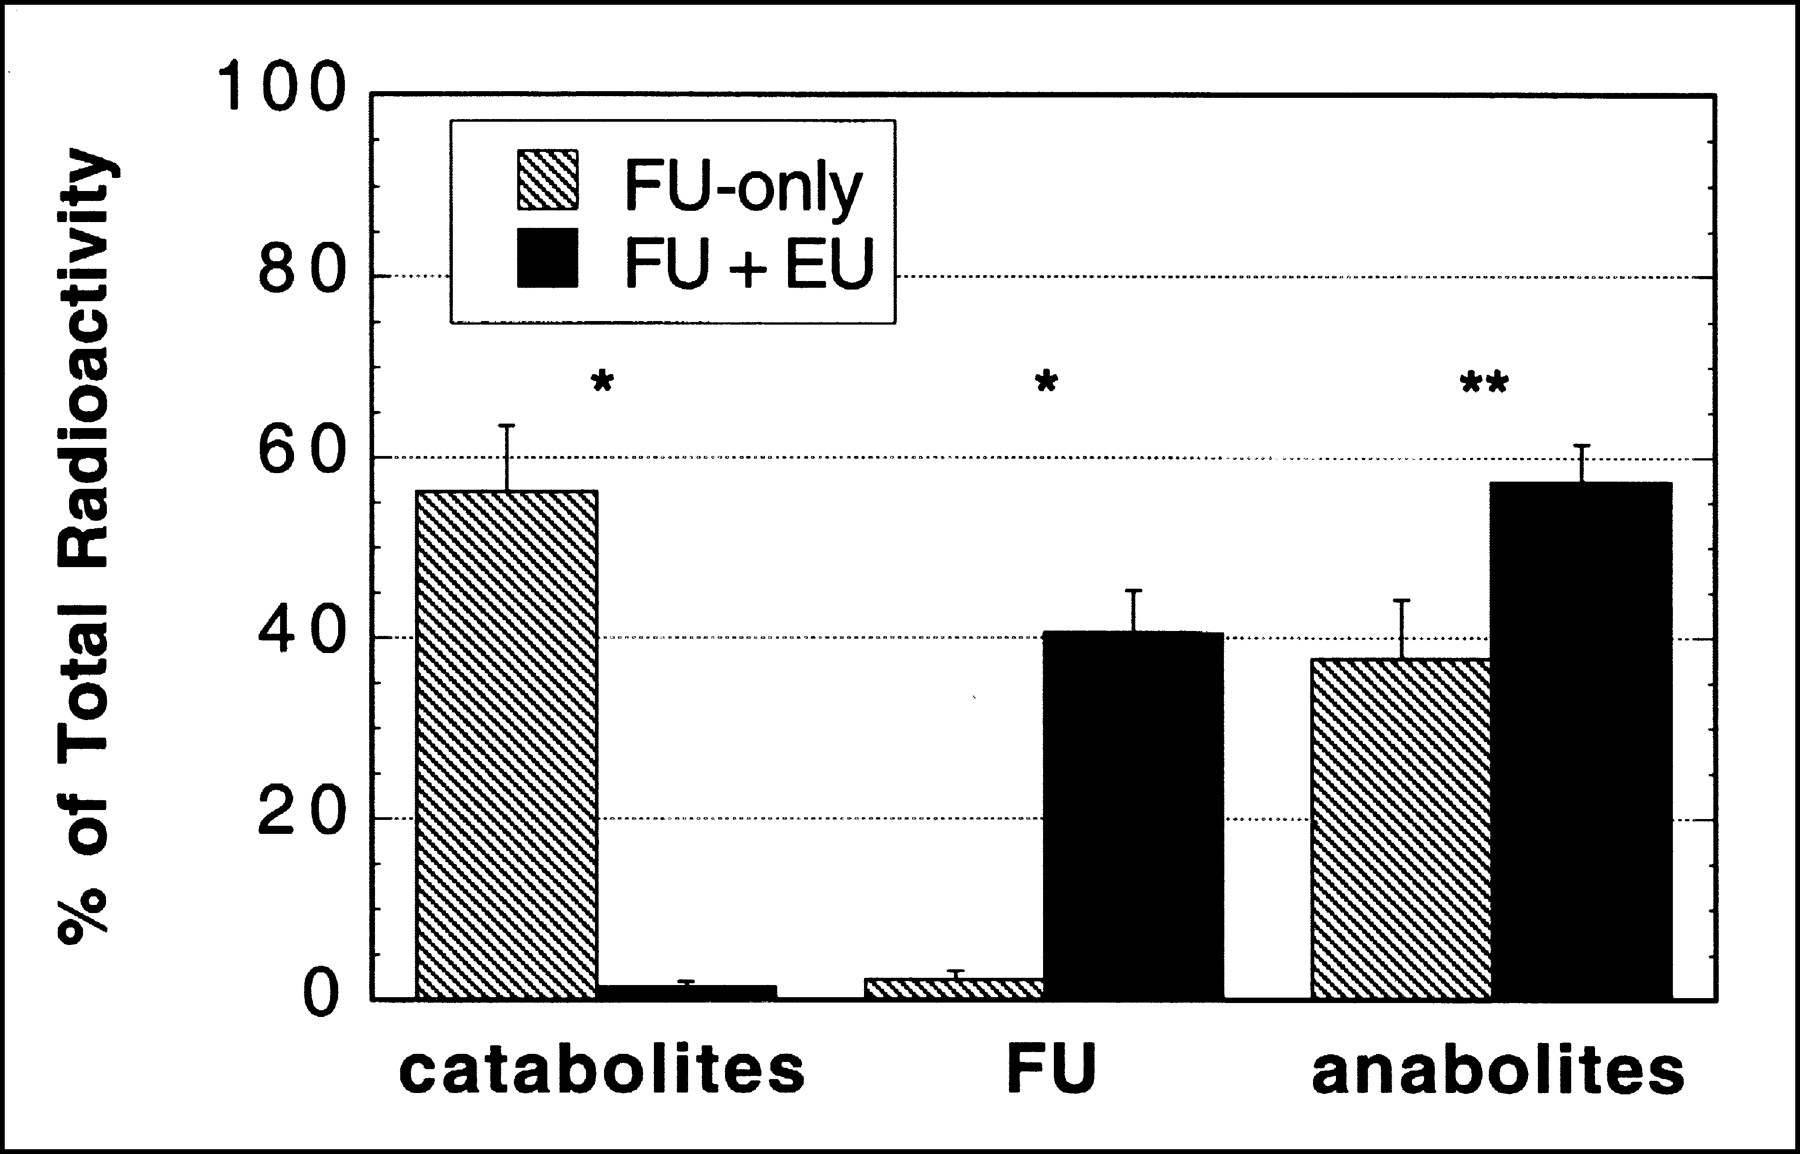
Findings regarding the molecular distribution of radiolabel in tumor at 2 h are presented in Table 3 and Figures 4 and 7. In studies without the blocker, roughly 50%–70% of the radiolabel in tumor was on catabolites, with the rest reflecting mainly various anabolites of FU. Pretreatment with eniluracil reduced labeled catabolites to ≤5% of total label in tumor, whereas FU and its anabolites accounted for approximately 40% and 60% of the radiolabel, respectively. With or without eniluracil, the anabolite fraction was composed mostly of macromolecules (AIF) and nucleotides plus a relatively small amount of nucleosides.

Effect of eniluracil (EU) on molecular distribution of radiolabel from FU in tumor at 2 h after injection. Data reflect percentages of recovered radioactivity. Data obtained with [18F]FU and [3H]FU were combined within each treatment group (i.e., eniluracil or placebo). Results with individual radiotracers are given in Table 3. n = 5 for FU-only; n = 8 for FU + EU. Error bars indicate SEMs. *P < 0.01; **P ≤ 0.05.
Molecular Distribution of Radiolabel in Tumors 2 Hours After Intravenous Injection of FU
Quantitative interpretation of studies with unmodulated [18F]FU was complicated by the presence of [18F]F− or compounds formed from the free fluoride ion (or both). Measuring 18F− by alumina adsorption and PbCl-18F precipitation, Ishiwata et al. (19) found fluoride ion to be the most prevalent labeled species in plasma ≥60 min after intravenous injection of [18F]FU in rats. In our study, HPLC analysis showed peaks corresponding to [18F]F− in only one of the experiments with unmodulated [18F]FU, and [18F]F− comprised only a small percentage of 18F recovered from plasma and tumor samples (Figs. 3 and 4; Tables 2 and 3). On the other hand, the dramatic rise in the time–activity curves for bone after 20 min (Fig. 6B) is consistent with incorporation of circulating 18F− into the bone matrix (24). Furthermore, measured recovery of radiolabel in HPLC studies was consistently less when [18F]FU was given without rather than with eniluracil (Tables 2 and 3). However, when [3H]FU was substituted for [18F]FU, recovery of radiolabel was very similar with and without eniluracil. The latter observation can be explained in terms of the defluorination reaction α-fluoro-β-[3H]alanine to F− + β-[3H]alanine (4) because β-alanine (BAL) coelutes with FBAL in our HPLC technique. In other words, in vivo defluorination of FBAL reduces recovery of 18F but not 3H in our HPLC technique. Considered together, our observations suggest that some of the 18F− was in a form that was not eluted from the HPLC columns. Thus, labeled catabolites of [18F]FU may have comprised a larger percentage of total activity in plasma and tumors than is indicated by the data on recovered activity presented in this article.
Although the HPLC technique did not completely separate FU anabolites in the RNA and DNA synthetic pathways, the metabolite analysis suggested that most of the radiolabel in tumor at 2 h after injection was in the RNA pathway. Although FdUDP and FdUTP were entirely indistinguishable from FUDP and FUTP, respectively, the chromatographic separation in most runs was adequate to permit identification of FdUrd, FUrd, FdUMP, and FUMP (Fig. 4). In all cases, the observed peaks in the radiochromatograms matched the standard peaks for FUrd and FUMP in the UV chromatograms, and there was little or no structure matching FdUrd or FdUMP. Furthermore, F-RNA was the predominant labeled species in the macromolecular (AIF) fraction. In two experiments with [3H]FU, the AIF from tumor was analyzed for its constituents by a standard technique involving successive removal of RNA and DNA nucleotides from the pellet by hydrolysis and hot-acid extraction (25). Eighty-four percent ± 2% of the radiolabel was in RNA, 12% ± 2% in DNA, and 5% ± 0.1% in protein.
DISCUSSION
In spite of its limited effectiveness, FU remains one of the most widely used drugs for certain common cancers. A great deal of effort is currently being directed at predicting tumor response to FU (13,26–28). One of the determinants of response is the uptake and metabolic activation (i.e., anabolism) of the drug by tumor cells, particularly as it relates to the formation of FdUMP, the fluoronucleotide that binds to and inactivates TS (29).
Modern methodologies make it possible to measure the pharmacokinetics of FU noninvasively. NMRS of 19F (NMRS/[19F]FU) has been used to measure the relative concentration of FU versus time in tumors after high-dose, bolus administration of the drug to patients (13). Tumors with FU retention half-times ≤ 20 min as determined by NMRS consistently fail to respond to FU. Tumor retention of radiolabel from [18F]FU as measured by quantitative PET (PET/[18F]FU) may also be a useful predictor of tumor response to FU. Investigators at Heidelberg recently reported an impressive correlation (r = 0.86; P ≤ 0.001) between tumor retention of radiolabel 2 h after intravenous or hepatic intra-arterial injection of [18F]FU and change in tumor size during subsequent treatment by continuous intravenous or intra-arterial infusion of FU (28).
The pharmacologic basis for the reported positive correlation between tumor response and NMRS/[19F]FU or PET/[18F]FU studies is not clear. Neither modality can detect either free FdUMP or binding of FdUMP to TS. Even with high-dose, bolus administrations of FU, the chemical concentrations of FdUMP present in tissue are far below the threshold of detectability with NMRS (13). Although PET is far more sensitive than NMRS, [18F]FdUMP comprises too small a fraction of the total radiolabel in tissue to be measured reliably. Various studies, including our own (Fig. 4), have shown that FdUMP and other anabolites of the DNA pathway constitute only a small percentage of the total fluorinated compounds in tissues during the first few hours after administration of FU (16,30). This is presumably related to the fact that cells synthesize RNA more or less continuously, but only form DNA during a relatively short portion of the cell cycle (i.e., S phase) (31). Furthermore, the concentration of TS in tumors and normal tissues (a few picomoles/gram (29)) is far too small in relation to currently achievable specific activities for [18F]FU (about 20 MBq/μmol) to permit detection of [18F]FdUMP bound to TS, given that the injected dose necessary for imaging is on the order of a few kilobecquerels/gram of body weight.
A plausible explanation of the observed correlation between tumor response to FU and either NMRS/[19F]FU or PET/[18F]FU is that these modalities measure the formation and retention of a precursor pool for FdUMP (4,25,32). Although FU essentially disappears from the bloodstream within an hour (8), measurable amounts of FU and its anabolites (principally F-RNA and nucleotides of the RNA synthetic pathway) persist in tumors for many hours after bolus intravenous injection of FU (25,30,32). This, plus the interconnectedness of the RNA and DNA pathways (Fig. 1), suggests that cells entering S phase many hours after FU administration may at that time form FdUMP from a persisting reservoir of FU and FU anabolites of the RNA pathway.
Although NMRS/[19F]FU and PET/[18F]FU appear to be useful in predicting tumor response, the information about FU pharmacokinetics provided by these techniques is very limited. Because of its low sensitivity, current use of NMRS/[19F]FU in humans requires pharmacologic doses of FU and is restricted in most cases to measurements of the relative retention of FU versus time in tumors lying near the surface of the body (13). The exquisitely high sensitivity of PET to the radiolabel affords PET/[18F]FU some important advantages over NMRS/[19F]FU, including optional use of subpharmacologic doses of FU, absolute quantitation with high temporal resolution, 3-dimensional imaging at any location within the body, and sensitivity to formation of macromolecules, which are transparent to NMRS/[19F]FU.
Unfortunately, the pharmacokinetics of FU in vivo are unfavorable for imaging studies with [18F]FU. Tumor uptake of 18F is often low relative to that in normal tissues (14,15), which hinders both tumor visualization and accurate measurement of tumor radioactivity. [18F]FU is rapidly destroyed in the liver, giving rise to high levels of recirculating, labeled catabolites. This obscures image interpretation and hinders modeling of the radiolabel kinetics. It has been argued that catabolites of FU are confined to the vascular space in tumors (33), but this seems unlikely, given the well-known leakiness of tumor capillaries to small molecules such as FU (34). We found uptake of radiolabel by the Ward tumor to be dominated by catabolites when [18F]FU was given without eniluracil (Figs. 4 and 7; Table 3). Our data show a distribution volume for labeled catabolites (defined as the ratio of the concentrations of total catabolites in tumor and plasma at 2 h) of 0.78 ± 0.04 mL/g (n = 4), suggesting that catabolites permeated both the extra- and intracellular water spaces of tumor tissue.
We hypothesize that the quality of information obtained with PET/[18F]FU can be substantially improved by using eniluracil to suppress catabolism of the radiotracer. This hypothesis is supported by the results of our study with respect to tumor visualization and interpretability of the PET images.
Our findings regarding the biodistribution, pharmacokinetics, and metabolism of unmodulated FU are similar to those of previous studies in rats and mice. In particular, Ishiwata et al. (19) and Abe et al. (35) also reported high uptake of 18F in bone and found that radiolabeled catabolites rapidly replaced [18F]FU in the blood after intravenous injection of [18F]FU in rats. Our results regarding the prevalence of catabolites of FU in tumors are similar to those reported recently by Adams et al. (16), who performed NMRS on colon tumors excised from mice at various times after administration of FU.
Overall tumor-to-normal tissue contrast improved with eniluracil (Fig. 2). Tumor uptake of 18F at 2 h increased relative to plasma, bone, liver, and kidney (Fig. 5). The roughly 5-fold improvement in tumor-to-liver contrast is especially relevant because liver is the primary site of metastasis in colon cancer, and imaging of colorectal hepatic metastases with [18F]FU is difficult because of low tumor uptake of radiolabel relative to that of liver (28). Surprisingly, tumor-to-muscle contrast did not improve with eniluracil because uptake of 18F in muscle increased when the blocker was used (Table 1). The data of Table 1 suggest that the relatively low uptake of 18F by muscle in FU-only experiments may have been caused by exclusion of [18F]F−, because muscle SUV was much higher when [3H]FU was substituted for [18F]FU in a FU-only study.
Eniluracil markedly altered the metabolic significance of tumor radioactivity (Fig. 7). Without the blocker, catabolites comprised a large percentage of the activity at 2 h. When the rats were pretreated with eniluracil, FU and its anabolites replaced catabolites as the prevalent radiolabeled species in tumor at 2 h. Thus, tumor images obtained with [18F]FU + eniluracil (Fig. 2A) reflected uptake and anabolism of FU, whereas those obtained with unmodulated [18F]FU represented primarily accumulation of labeled catabolites.
The results of this study indicate that the pharmacokinetics of FU modulated by eniluracil are favorable for kinetic modeling of tumor uptake and metabolic activation of FU using PET and [18F]FU. Our next step will be to determine whether modeling of data obtained with the PET/[18F]FU + eniluracil technique provides useful information (i.e., accurate measurements of identifiable aspects of [18F]FU transport and metabolism) in the Ward tumor model. Given the complexity of the anabolic pathways of FU (Fig. 1), it seems clear that time–activity curves derived from PET (Fig. 6A) do not contain enough information to permit complete determination of the pharmacokinetics of [18F]FU in tumors. The modeling problem may be simplified by the empirical fact that tumor radioactivity is composed mainly of FU and FU metabolites of the RNA pathway. Other investigators have successfully described pyrimidine kinetics in tumors with relatively simple models. For example, Mankoff et al. (36) recently showed that tumor incorporation of 11C-thymidine (TdR) into DNA can be accurately computed with a 2-compartmental model that lumps TdR with thymidine nucleotides. Whatever the limitations, it seems likely that the combination of PET/[18F]FU + eniluracil and kinetic modeling will provide information about FU kinetics in tumors that cannot be obtained with either the NMRS/[19F]FU or the PET/[18F]FU technique.
The potential relevance of the PET/[18F]FU + eniluracil technique to chemotherapy depends on how well the method simulates the kinetics of FU in tumors during treatment. PET/[18F]FU + eniluracil is most likely to be useful for treatments that combine FU with eniluracil, because the technique can be made to simulate closely the pharmacokinetics of FU during such treatments. Eniluracil and other DPD inactivators are currently receiving considerable attention because their use permits oral administration of FU, and there is growing recognition of the importance of DPD-mediated tumor resistance to FU (17). It appears that FU + eniluracil may become an approved method of treatment for metastatic disease in several prevalent types of cancer. Phase I and II clinical trials of FU + eniluracil in advanced colorectal, breast, and head-and-neck cancers have been completed at several centers (37–39). The clinical safety and efficacy of FU + eniluracil have been found consistently to be comparable with or superior to those of intravenous FU. Phase III clinical trials are in progress both in the United States and abroad.
The extent to which the PET/[18F]FU + eniluracil technique may be applicable to FU-based therapies that do not use eniluracil cannot be predicted because of the lack of relevant information about the pharmacokinetics of FU in tumors. A major goal of our intended research is to provide the needed information. Some factors that might restrict the applicability of the method include the following: (a) There is evidence that catabolites inhibit tumor response to FU (18). If this reflects an influence of catabolites on FU kinetics in tumors, catabolite suppression in the PET/[18F]FU + eniluracil technique may cause the method not to simulate accurately the anabolic kinetics of FU in treatments that do not use DPD inhibition. (b) Because eniluracil preserves FU, only very low doses of FU are permissible in conjunction with eniluracil. Thus, circulating levels of FU during the very early period after high-dose, bolus administration of the drug cannot be imitated safely in the PET/[18F]FU + eniluracil technique. (c) Eniluracil may influence the anabolic as well as the catabolic metabolism of FU. (We note that (c) appears not to be true, because eniluracil has been found to improve the lethality of FU in tumor cells with high DPD expression but not to affect FU toxicity in tumor cells with low DPD expression (17). This suggests that DPD inactivation is the only significant effect of eniluracil in tumors.) Another consideration is that PET/[18F]FU + eniluracil is necessarily insensitive to DPD-mediated tumor resistance. However, this may not be important in practice because of the recent advent of DPD assays of tumor biopsy specimens (40). Thus, in the near future, patients with DPD-mediated tumor resistance may be identified in advance and treated either with FU plus a DPD inactivator or with drugs not affected by DPD.
CONCLUSION
We have shown in the Ward tumor model that eniluracil is highly effective in blocking catabolism of [18F]FU and that suppression of catabolism improves the biodistribution of 18F with regard to tumor visualization with PET. Without the blocker, tumor radioactivity at 2 h was associated predominately with catabolites. With catabolism eliminated, tumor activity at 2 h was associated primarily with FU and its anabolites. Thus, eniluracil effectively removed unwanted background activity and greatly enhanced the depiction of therapeutically significant cellular uptake and anabolism of FU in PET images. This strategy may prove helpful in the development of PET for noninvasive measurement of FU pharmacokinetics in human tumors.
Acknowledgments
The Ward tumor was provided by Dr. Yousef Rustum, Roswell Park Cancer Institute, Buffalo, NY. This work was funded in part by the James H. Zumberge Faculty Research and Innovation Fund, University of Southern California. Eniluracil was a gift from Glaxo Wellcome, Inc., through Dr. Thomas Spector. Glaxo Wellcome also provided partial funding for the purchase and housing of rats used in the project.
Footnotes
Received Sep. 8, 1999; revision accepted Jan. 12, 2000.
For correspondence or reprints contact: James R. Bading, PhD, PET Imaging Science Center, University of Southern California, 1510 San Pablo St., Ste. 350, Los Angeles, CA 90033-4609.


