


Abstract
Intracranial or intraventricular blood pools have been suggested as noninvasive sources of an input function for quantitative PET. These techniques measure the concentration of the tracer in whole blood, but the concentration in plasma depends on the equilibration of the tracer between plasma and erythrocytes. Methods: FDG, 6-[18F]fluoro-l-m-tyrosine (FmT), or its major metabolite, 6-[18F]fluoro-3-hydroxyphenylacetic acid (FHPAA), was added to blood samples obtained from healthy fasting volunteers along with radioiodinated human serum albumin (RIHSA). Samples were incubated at 37°C for times between 10 s and 2 h and then plunged into an ice bath and centrifuged. Whole blood and plasma were counted for 18F and 125I activities. The resulting time courses were fit to successively more complex models, evaluated using an F test. Results: All radioactivity associated with RIHSA remained in the plasma, whereas FDG equilibrated instantaneously between plasma and erythrocytes. FmT took about 1 h to equilibrate between plasma and erythrocytes; this time course could be described by a single exponential with a half-life of 10 min. FHPAA equilibrated within the first 5 min of the study. Conclusion: Our results show that, unlike FDG, the partitioning of FmT between plasma and erythrocytes is a relatively slow process. We present an analytic correction that may be applied to the measured time course of radioactivity in whole blood to obtain the time course of the tracer in plasma.
The accurate characterization of an input function, usually the time course of the radioactive tracer in circulating plasma, is a prerequisite for accurate quantification in PET studies (1). Arterial cannulation and sampling remain the gold standard for input functions (2). Strategies have been devised to avoid the manual handling of multiple blood samples, especially at the beginning of the experiment when the radioactivity concentration varies rapidly. These include automated blood sampling devices (3,4) and continuous monitoring devices (5,6). A promising approach that does not suffer from the delay and dispersion of the tracer concentration between the arterial sampling point and the organ of interest (5,7) is the use of intraventricular (8) or intracranial (9,10) blood pools as input functions. These noninvasive techniques provide estimates of tracer concentrations in whole blood, rather than plasma, and, therefore, consideration of the equilibration of the tracer between plasma and erythrocytes is important. In some cases, this equilibration is very rapid—on the order of seconds for glucose (11) or fluorodeoxyglucose (8)—and the equilibrium distribution ratio (ratio of the concentration in the erythrocyte to that in the plasma) is close to unity. In these cases, the time–activity curves in whole blood and plasma are effectively identical, and the use of either as an input function is justified. In other cases, the tracer may be actively concentrated in or excluded from the erythrocytes, or equilibration may be slow. For example, 11C-labeled carbon monoxide accumulates and 68Ga-ethylenediaminetetraacetate is excluded from the erythrocytes; l-3,4-[3-14C]dihydroxyphenylalanine (DOPA) equilibrates with red blood cells with a half-life of 1 h (12).
We present here a general derivation that takes into account the partitioning of any tracer between plasma and erythrocytes. We illustrate this approach using 6-[18F]fluoro-l-m-tyrosine (FmT), a substrate for aromatic amino acid decarboxylase that is not subject to O-methylation (13,14) and is a useful tool in clinical studies of movement disorders (15). The metabolism of FmT has been studied in humans (16) as well as in rodents and monkeys (17–20), but the uptake of FmT into red blood cells has not yet been addressed. A careful determination of the equilibration of radiotracers such as FmT and 18F-DOPA in whole blood is essential for the use of intracranial blood pools as input functions for studies of the presynaptic dopaminergic system; this characterization is a necessary step toward the widespread availability of quantitative, clinical PET.
MATERIALS AND METHODS
Tracers and Reagents
A solution of acid citrate-dextrose (ACD), obtained from the in-patient pharmacy of the McMaster University Medical Centre, was used as an anticoagulant in all experiments. Radioiodinated (125I labeled) human serum albumin (RIHSA; specific activity, 0.01 MBq/mg) was obtained from Draximage (Kirkland, Quebec, Canada). One hundred kilobecquerels were diluted to 100 mL with isotonic saline. RIHSA was used as a marker that would remain in the plasma.
FmT and 6-[18F]fluoro-3-hydroxyphenylacetic acid (FHPAA; specific activity, 0.13 GBq/mmol) (21,22), and FDG (specific activity, 108 GBq/mmol) (23) were prepared using routine laboratory protocols. One hundred to 300 MBq were diluted to 100 mL with isotonic saline. FHPAA was studied because it is the only metabolite of FmT that is present in any significant amount in blood in vivo (16).
About 200 mL venous blood from 2 fasting healthy volunteers from the laboratory staff were drawn directly into syringes containing ACD (1 volume ACD:6 volumes blood) on the day of the experiment. Blood was withdrawn slowly from an antecubital vein using a 19-gauge needle. The blood was divided into 5-mL aliquots that were kept mixed gently in a water bath maintained at 37°C. The hematocrit of each aliquot was measured, in duplicate, using a microhematocrit technique in which the samples were centrifuged for 5 min at 8000 rpm (Readcrit centrifuge; Clay Adams, Parsippany, NJ). Each measured value was corrected for systematic overestimation by a microhematocrit value of 1.5% (24).
Equilibrium Experiments
One hundred microliters RIHSA (∼100 Bq) and 100 mL FmT, FHPAA, or FDG (∼100 kBq) were added to a tube. The tube was gently mixed and kept at 37°C for incubation times varying from 10 s to 2 h. Incubation was stopped by plunging the tube into an ice bath. For each experiment, 15–17 time points were obtained.
Each aliquot was divided into 2 parts after incubation. Two milliliters whole blood were removed, and the red cells were lysed by the addition of 5 mg saponin (Sigma Chemicals, St. Louis, MO). The sample was then centrifuged, and 1 mL was transferred to a counting tube. The remaining 3 mL blood were centrifuged at 4°C for 10 min at 3000 rpm (IEC Centra-7R; International Equipment Co., Needham Heights, MA), and 1 mL supernatant was transferred to a counting tube.
Samples were counted immediately for 18F radioactivity. They were then stored for 3 d and counted for 125I radioactivity (Minaxi gamma 5000 series; Canberra Packard, Mississauga, Ontario, Canada). All samples were corrected for physical decay from the start of the experiment. Thus, we obtained the in vitro time course of radioactivity in plasma and whole blood for FDG (2 replicates), FmT (4 replicates), FHPAA (4 replicates), and RIHSA (6 replicates).
In the experiments with FmT and FHPAA, samples with incubation times of 5, 30, and 90 min were analyzed for metabolites by passing a 0.2-mL aliquot of plasma through an anion-exchange column followed by passage through a cation-exchange column (16). The acid metabolite of FmT (FHPAA) is retained on the anion-exchange resin, whereas the amine metabolite (6-fluoro-m-tyramine) is retained on the cation-exchange resin. Neither resin has affinity toward FmT, which is collected in the eluate.
Analysis
We calculated the concentration of the tracer in the erythrocytes, Ce, from the measured concentration in whole blood, Cw, and plasma, Cp, as:
 Eq. 1
Eq. 1
 Eq. 2
where H is the corrected hematocrit.
Eq. 2
where H is the corrected hematocrit.
Following Hagenfeldt and Arvidsson (25), we then computed the distribution ratio, R(t) = Ce(t)/Cp(t), by first expressing both erythrocyte and plasma concentrations in Bq/kg water, assuming that plasma contains 0.94 kg water/L and erythrocytes contain 0.73 kg/L (26).
R(t) at the time of injection is zero and grows toward some equilibrium value, Re ≡ limt→∞R(t). The shape of this function will depend on the mechanisms of uptake for the tracer of interest; DOPA, for example, is transported into erythrocytes by carrier-mediated facilitated diffusion, exhibiting both saturable and nonsaturable components (12).
We modeled the in vitro equilibration of the tracer between the plasma and erythrocytes as a closed 2-compartment system. In 1 mL whole blood, the plasma compartment has volume (1 − H) mL and initial concentration Cp(0), which we can arbitrarily scale to be 1/(1 − H) Bq/mL. The erythrocyte compartment has volume H mL and initial concentration Ce(0) = 0. The flux of tracer from the plasma to the erythrocytes at any time is given by k1Cp(t)(1 − H); the backflux of tracer from the erythrocytes to the plasma compartment is given by k2Ce(t)H. Because H is known, this model has 2 free parameters, k1 and k2, expressed in units of inverse time.
The solution to this 2-parameter compartmental model yields the following expression for the distribution ratio:
 Eq. 3and it is clear that as equilibrium is reached:
 Eq. 4
Eq. 4
A possible simplification of this model is to assume that the transfer of tracer molecules across the erythrocyte membrane has the same probability in both directions. This corresponds to a single value of the clearance, K, between the 2 compartments (27). Intuitively, the clearance is the volume that is exchanged between compartments per unit time (in mL/min). Under this assumption, we find that k1 = K/(1 − H) and k2 = K/H, which reduces Equation 3 to:
 Eq. 5
where a is the equilibration rate constant, defined to equal K/[H(1 − H)]. We refer to the model described by Equation 5 as the 1-parameter compartmental model. Under these conditions it is clear from Equation 4 that Re = 1.
Eq. 5
where a is the equilibration rate constant, defined to equal K/[H(1 − H)]. We refer to the model described by Equation 5 as the 1-parameter compartmental model. Under these conditions it is clear from Equation 4 that Re = 1.
We calculated R(t) from the measured data and fit the various models separately to the data obtained in each experiment, using a Nelder-Mead simplex search method (28). To address the issue of model order, we evaluated the best fit that could be obtained using a straight line or the 1-parameter compartmental model, the 2-parameter compartmental model, or 3 different 3-parameter exponential models. The weighted residual sum of squares achieved with successively more complex models was evaluated using an F test (29). All other significance tests were computed using a Student t test.
RESULTS
Table 1 gives the labeled species in plasma after the incubation of whole blood with FmT or FHPAA for 5, 30, and 90 min and confirms that these tracers were not metabolized in the blood during the course of the experiment.
Radiolabeled Species in Plasma After Incubation of Whole Blood with FmT or FHPAA
For FmT, a compartmental model provided a significantly better fit than a straight line (P < 0.001) in every experiment. However, the 2-parameter model did not fit the data significantly better than the 1-parameter compartmental model (P > 0.1). We concluded that the 1-parameter model described by Equation 5 was the most appropriate model for the FmT data. For FHPAA, the 2-parameter model provided a significantly better fit than either a straight line or the 1-parameter compartmental model. A 3-parameter model provided a better fit than the 2-parameter model in 2 of 4 replicates, but in both cases 0.05 < P < 0.1. Thus, we concluded that Equation 3 was an appropriate model for the data obtained with FHPAA.
Figure 1A illustrates the time course of the measured R(t) for 4 replicates of the FmT experiment. Solid lines show the best fit of Equation 5 to these data. For FmT, the mean value of K was 0.017 ± 0.002 mL/min; the mean value of the exponential factor, a = K/[H(1 − H)], was 0.069 ± 0.010 per minute]. Figure 1B shows the measured R(t) for 4 replicates of FHPAA. Solid lines show the best fit of Equation 3 to these data. The mean values of the best-fit parameters were k1, 0.26 ± 0.06 per minute; k2, 0.45 ± 0.11 per minute. The mean value for Re, as calculated in Equation 4, was 0.87 ± 0.02.
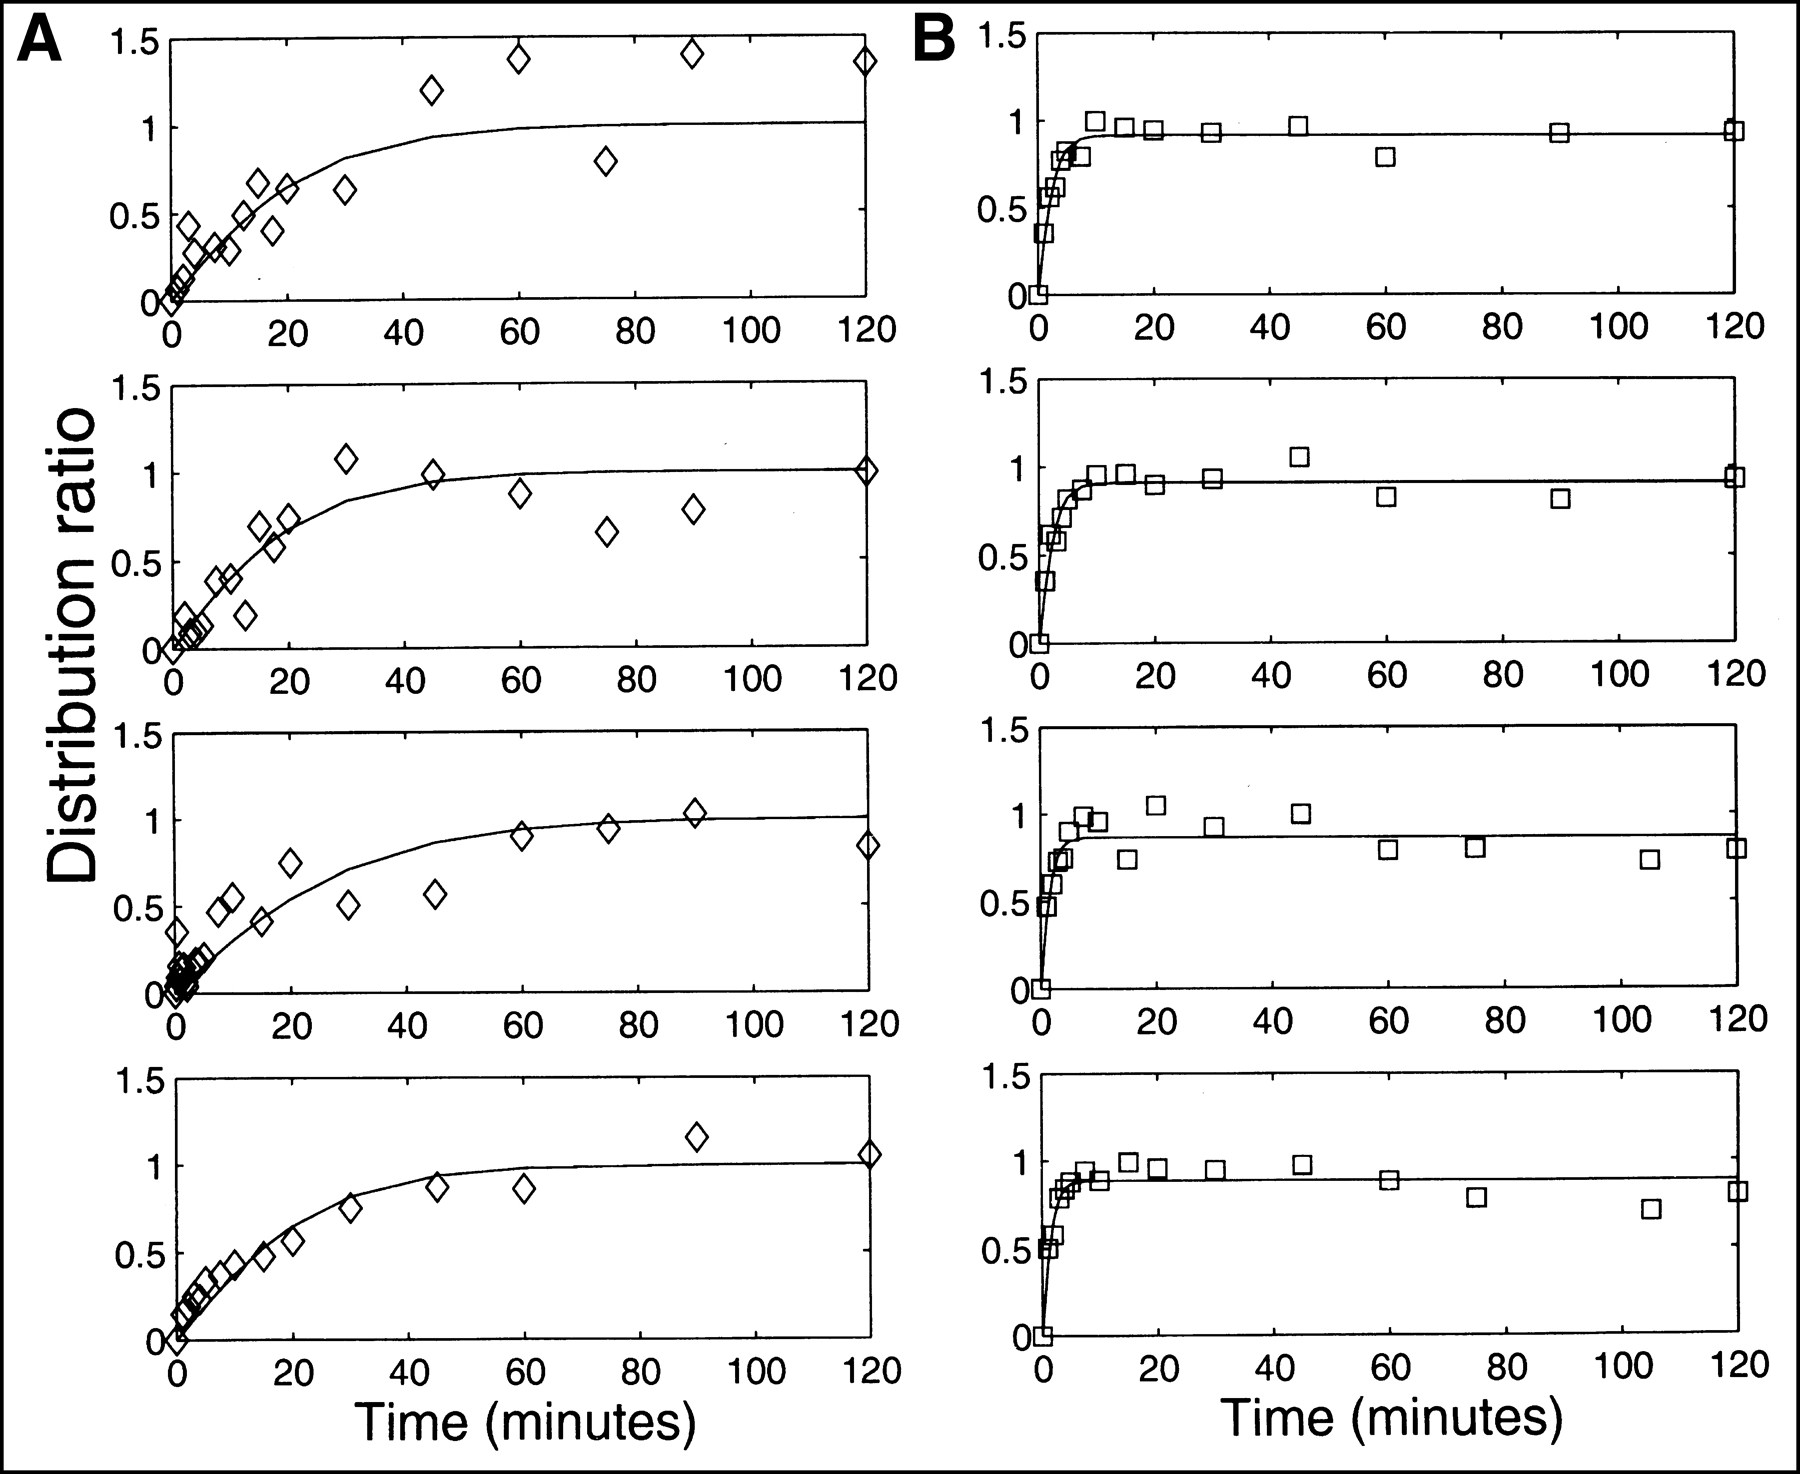
Time course of measured R(t) for FmT (A, ⋄) and FHPAA (B, □). Solid lines show best fit to these data by most appropriate model, as determined using F statistic. Most appropriate model for FmT data was determined to be 1-parameter compartmental model described by Equation 3; for FHPAA appropriate model was 2-parameter compartmental model (Eq. 5).
For both FDG and RIHSA, neither compartmental model provided a significantly better fit to the data than a straight line (P > 0.5 in 7/8 replicates). Thus, we were constrained to fit only a single parameter, Re, to the data. For FDG, Re was not significantly different from 1 (P > 0.1), whereas for RIHSA, Re was not significantly different from 0 (P > 0.1).
These results are summarized in Figure 2, which shows the time course of the population mean (calculated from the mean values of the best-fit parameters) for each of the 4 tracers. The error bars show the interexperiment variation in the mean value of Re for FDG, RIHSA, and FHPAA; note that Re is constrained to equal 1 by the model used for the FmT data. Figure 2 succinctly illustrates the major results of this study: All radioactivity associated with RIHSA remained in the plasma; FDG equilibrated instantaneously between plasma and erythrocytes; FmT equilibrated between plasma and erythrocytes in ∼1 h; and FHPAA equilibrated within the first 5 min of the study.

Time course of R(t) for each of 4 tracers. Population mean values of best-fit parameters were used to calculate R(t) for FDG (dotted line), RIHSA (dotted-dashed line), FmT (solid line), and FHPAA (dashed line). Error bars show mean value ± 1 SD of Re for FDG, RIHSA, and FHPAA; Re is constrained to equal 1 by model used for FmT data. Re was not significantly different from 1 for FDG and not significantly different from 0 for RIHSA. Inset replots equilibration of FHPAA (dashed line), with population mean of metabolite fraction (dotted line) from in vivo FmT studies. Note different time scale.
The inset in Figure 2 replots the equilibration of FHPAA with the population mean of the metabolite fraction, the fraction of the total counts in plasma that can be attributed to the metabolites of FmT during a 2-h in vivo study (16). From the inset it is clear that FHPAA equilibrates between plasma and erythrocytes at a faster rate than FHPAA is produced from FmT in vivo.
The models we used were clearly adequate to capture the pattern of tracer uptake by the erythrocytes over a 2-h experiment, given measurement noise. Counting error was <1.5% for all samples, but other likely sources of noise include the error on the hematocrit measurement (<5% SD; C. Nahmias and L. M. Wahl, unpublished data, June 1999), and the pipetting error (2.4% SD on 1 mL; 1.4% on 100 mL; C. Nahmias and L. M. Wahl, unpublished data, June 1999). For short incubation times, the time at which incubation was halted may have been a further source of error.
DISCUSSION
Using Whole-Blood Time–Activity Curves
When the concentration of a radiotracer is measured in whole blood (10), a correction may need to be applied to obtain the concentration time course in plasma. In general, this is given by substituting Equation 3 into Equation 2:
 Eq. 6
Eq. 6
Note that if k1 is close to 0, equilibrium is never reached, and Cp(t) ≈ Cw(t)/(1 − H), as is the case for RIHSA. Under the condition that the tracer crosses the boundary between compartments with equal probability in both directions, we find that Equation 6 reduces to:
 Eq. 7
with a = K/[H(1 − H)]. Here we see that if K is large, equilibrium is reached rapidly, and Cp(t) ≈ Cw(t), as in the case for FDG.
Eq. 7
with a = K/[H(1 − H)]. Here we see that if K is large, equilibrium is reached rapidly, and Cp(t) ≈ Cw(t), as in the case for FDG.
A possible complication in this analysis occurs if the tracer is metabolized during the time course of the experiment, if radiolabeled metabolites are present in the blood, and if the uptake of these metabolites by the erythrocytes is slow. If all 3 conditions are met, the corrections suggested here (Eq. 6 or Eq. 7) would overestimate the true concentration of unmetabolized tracer in the plasma.
Results for FmT
Our results show that, unlike FDG, the partitioning of FmT between plasma and erythrocytes is a relatively slow process. These results, obtained in vitro, agree well with the partitioning of FmT that we observed in vivo (10). Although much of the amino acid transport has no function in mature red blood cells, there exist at least 7 distinct routes of entry of amino acids into erythrocytes that represent secondary active transport, facilitated diffusion, as well as simple diffusion, at least to a limited extent (30,31). For l-tyrosine, the equilibrium ratio between red cells and plasma is slightly greater than unity, in favor of the red cells (25,32). Equilibrium is reached after about 1 h of incubation (32), in contrast with equilibration times of just a few minutes for other large neutral amino acids (30) or up to 4 h for DOPA (12). It has been reported that tyrosine does not bind appreciably to plasma proteins (32).
The uptake of FmT by erythrocytes most probably occurs through a combination of saturable and nonsaturable components, as has been found for both tyrosine (31) and DOPA (12). Like l-tyrosine, the equilibration of FmT between plasma and erythrocytes is reached within 1 h. Our results show that this equilibration is described well by a single exponential (the 1-parameter compartmental model), with a half-life of approximately 10 min. Therefore, we conclude that the correction given by Equation 7 should be applied to whole blood time–activity curves to calculate an appropriate input function for this tracer. Our results suggest that a K value of 0.017 mL/min has little intersubject variation and may be used in Equation 7 as a population mean, where H is the hematocrit for each subject, measured at the time of the study.
We also find that the predominant labeled metabolite of FmT, FHPAA, equilibrates quickly between erythrocytes and plasma. This equilibration can occur through a combination of diffusion of the undissociated acid, an anion-exchange mechanism on the anion transporter band 3, an intrinsic membrane protein, and, possibly, the specific monocarboxylate cotransporter (33,34). The efflux of the acid, from the erythrocytes back to plasma, may be greater than its influx into cells. The rate of this equilibration is significantly faster than the rate at which FmT is metabolized to FHPAA in vivo (Fig. 2, inset). Under this condition, an accurate estimate of Cp(t) can be made by first correcting for the contribution of the metabolites (16) and then partitioning the remaining counts in whole blood between plasma and erythrocytes (Eq. 7). The correction for labeled metabolites does not require additional partitioning because equilibrium is achieved relatively quickly.
To test the magnitude of the correction between whole blood and plasma time–activity curves in vivo, we applied Equation 7 to the in vivo time course of FmT in whole blood (10). The integral under the corrected plasma time–activity curve was 17.7% greater than the integrated whole-blood curve. Thus, if no correction were made (under the assumption of instantaneous equilibration between plasma and erythrocytes, or Cp(t) ≈ Cw(t)), the plasma time–activity curve would be significantly underestimated. Similarly, under the assumption that the tracer does not equilibrate between plasma and erythrocytes during the time course of the study (Cp(t) ≈ Cw(t)/(1 − H)), the plasma time–activity curve would be overestimated; we found the integral under the plasma time–activity curve was 29.4% greater under this assumption than when Equation 7 was used.
It should be noted that Equations 6 and 7 can be applied to the measured time course of radioactivity in whole blood to obtain the time course in plasma of any tracer that equilibrates relatively slowly in the blood, provided the equilibration rate constants have been determined in vitro.
CONCLUSION
Before whole-blood time–activity curves can be used as input functions for PET, the equilibration between plasma and erythrocytes of both the tracer and of other labeled species must be characterized. We found that FmT, a marker for presynaptic dopamine metabolism, equilibrates in the blood with a single exponential time course and a half-life of about 10 min.
Acknowledgments
The authors thank Jia Jun Chen for analysis of the plasma metabolites, Margo Thompson for untiring support, and Scott McNaughton for help with data collection. The generous support of the Natural Sciences and Engineering Research Council of Canada is acknowledged.
Footnotes
Received Jul. 26, 1999; revision accepted Feb. 16, 2000.
For correspondence or reprints contact: Claude Nahmias, PhD, Department of Nuclear Medicine, HSC-1P, McMaster University Medical Centre, 1200 Main St. W., Hamilton, Ontario, L8N 3Z5, Canada.
REFERENCES
In this issue


Jump to section
Related Articles
Cited By...
- 18F-Tetrafluoroborate, a PET Probe for Imaging Sodium/Iodide Symporter Expression: Whole-Body Biodistribution, Safety, and Radiation Dosimetry in Thyroid Cancer Patients
- Hepatic glucose utilization in hepatic steatosis and obesity
- Image-Derived Input Function for Assessment of 18F-FDG Uptake by the Inflamed Lung
- Uptake of 18fluorodeoxyglucose in the cystic fibrosis lung: a measure of lung inflammation?